

Protein-protein interaction networks suggest different targets have different propensities for triggering drug resistance
- PMID: 22132058
- PMCID: PMC3065591
- DOI: 10.1007/s11693-011-9076-5
Protein-protein interaction networks suggest different targets have different propensities for triggering drug resistance
Abstract
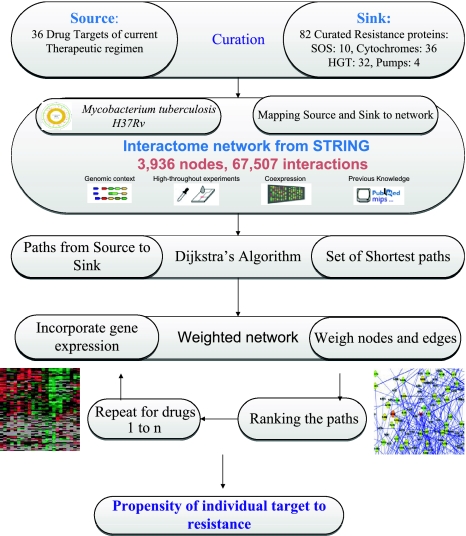
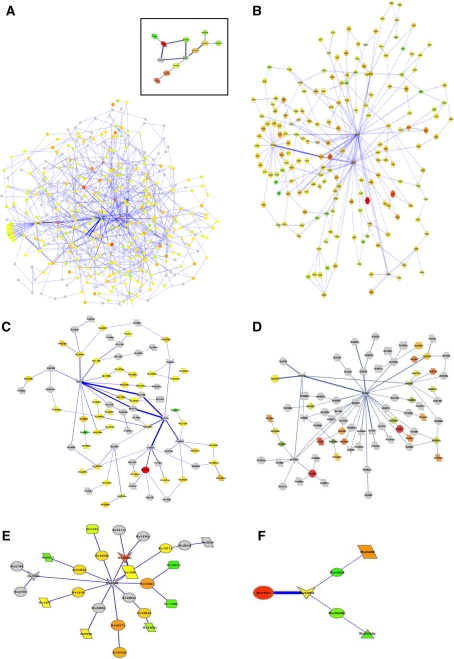
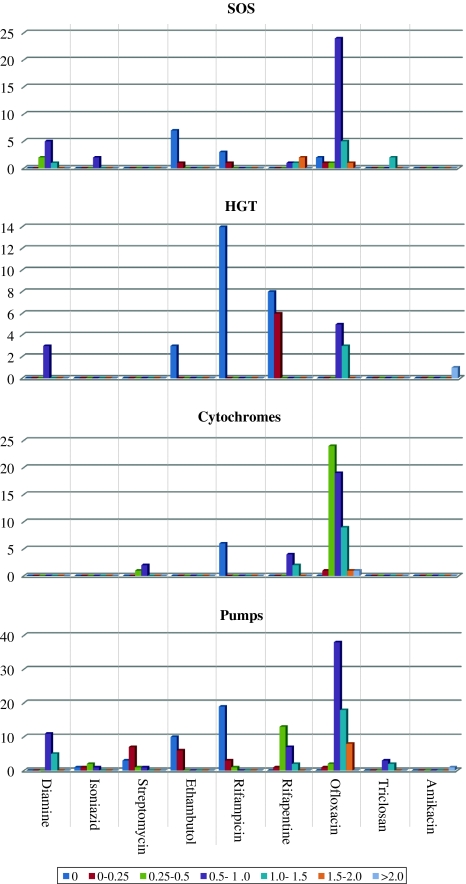
Emergence of drug resistance is a major problem in the treatment of many diseases including tuberculosis. To tackle the problem from a wholistic perspective, it is essential to understand the molecular mechanisms by which bacteria acquire drug resistance using a systems approach. Availability of genome-scale data of expression profiles under different drug exposed conditions and protein-protein interactions, makes it feasible to reconstruct and analyze systems-level models. A number of proteins involved in different resistance mechanisms, referred to as the resistome are identified from literature. The interaction of the drug directly with the resistome is unable to explain most resistance processes adequately, including that of increased mutations in the target's binding site. We recently hypothesized that some communication might exist from the drug environment to the resistome to trigger emergence of drug resistance. We report here a network based approach to identify most plausible paths of such communication in Mycobacterium tuberculosis. Networks capturing both structural and functional linkages among various proteins were weighted based on gene expression profiles upon exposure to specific drugs and betweenness centrality of the interactions. Our analysis suggests that different drug targets and hence different drugs could trigger the resistome to different extents and through different routes. The identified paths correlate well with the mechanisms known through experiment. Some examples of the top ranked hubs in multiple drug specific networks are PolA, FadD1, CydA, a monoxygenase and GltS, which could serve as co-targets, that could be inhibited in order to retard resistance related communication in the cell.
Keywords: Emergence of resistance; Network analysis; Resistome.
Figures

Similar articles
-
Mycobacterium tuberculosis interactome analysis unravels potential pathways to drug resistance.BMC Microbiol. 2008 Dec 23;8:234. doi: 10.1186/1471-2180-8-234. BMC Microbiol. 2008. PMID: 19105810 Free PMC article.
-
Maximum flow approach to prioritize potential drug targets of Mycobacterium tuberculosis H37Rv from protein-protein interaction network.Clin Transl Med. 2015 Dec;4(1):61. doi: 10.1186/s40169-015-0061-6. Epub 2015 Jun 5. Clin Transl Med. 2015. PMID: 26061871 Free PMC article.
-
SCNrank: spectral clustering for network-based ranking to reveal potential drug targets and its application in pancreatic ductal adenocarcinoma.BMC Med Genomics. 2020 Apr 3;13(Suppl 5):50. doi: 10.1186/s12920-020-0681-6. BMC Med Genomics. 2020. PMID: 32241274 Free PMC article.
-
Tuberculosis.In: Holmes KK, Bertozzi S, Bloom BR, Jha P, editors. Major Infectious Diseases. 3rd edition. Washington (DC): The International Bank for Reconstruction and Development / The World Bank; 2017 Nov 3. Chapter 11. In: Holmes KK, Bertozzi S, Bloom BR, Jha P, editors. Major Infectious Diseases. 3rd edition. Washington (DC): The International Bank for Reconstruction and Development / The World Bank; 2017 Nov 3. Chapter 11. PMID: 30212088 Free Books & Documents. Review.
-
Systems biology of tuberculosis.Tuberculosis (Edinb). 2011 Sep;91(5):487-96. doi: 10.1016/j.tube.2011.02.008. Epub 2011 Apr 1. Tuberculosis (Edinb). 2011. PMID: 21459043 Review.
Cited by
-
Structure and dynamics of molecular networks: a novel paradigm of drug discovery: a comprehensive review.Pharmacol Ther. 2013 Jun;138(3):333-408. doi: 10.1016/j.pharmthera.2013.01.016. Epub 2013 Feb 4. Pharmacol Ther. 2013. PMID: 23384594 Free PMC article. Review.
-
Resistome analysis of Mycobacterium tuberculosis: Identification of aminoglycoside 2'-Nacetyltransferase (AAC) as co-target for drug desigining.Bioinformation. 2013;9(4):174-81. doi: 10.6026/97320630009174. Epub 2013 Feb 21. Bioinformation. 2013. PMID: 23519100 Free PMC article.
-
EpiTracer - an algorithm for identifying epicenters in condition-specific biological networks.BMC Genomics. 2016 Aug 18;17 Suppl 4(Suppl 4):543. doi: 10.1186/s12864-016-2792-1. BMC Genomics. 2016. PMID: 27556637 Free PMC article.
-
Label-Free Comparative Proteomics of Differentially Expressed Mycobacterium tuberculosis Protein in Rifampicin-Related Drug-Resistant Strains.Pathogens. 2021 May 15;10(5):607. doi: 10.3390/pathogens10050607. Pathogens. 2021. PMID: 34063426 Free PMC article.
-
Study of the rifampin monoresistance mechanism in Mycobacterium tuberculosis.Antimicrob Agents Chemother. 2013 Feb;57(2):893-900. doi: 10.1128/AAC.01024-12. Epub 2012 Dec 3. Antimicrob Agents Chemother. 2013. PMID: 23208715 Free PMC article.
References
LinkOut - more resources
Full Text Sources
