

Sirtuin 1-mediated cellular metabolic memory of high glucose via the LKB1/AMPK/ROS pathway and therapeutic effects of metformin
- PMID: 22124463
- PMCID: PMC3237662
- DOI: 10.2337/db11-0416
Sirtuin 1-mediated cellular metabolic memory of high glucose via the LKB1/AMPK/ROS pathway and therapeutic effects of metformin
Abstract
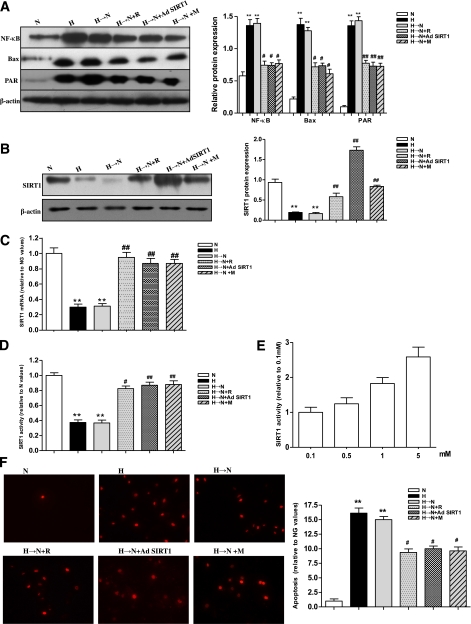
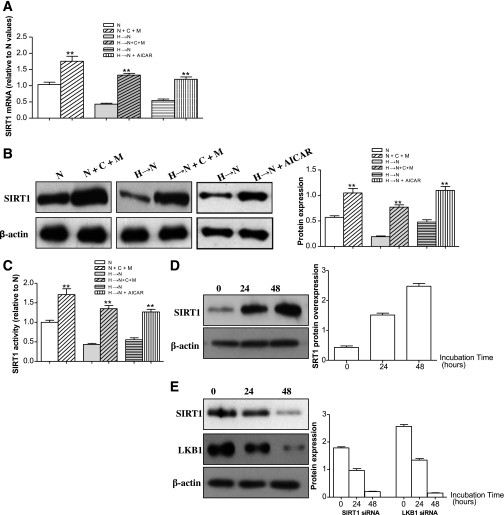
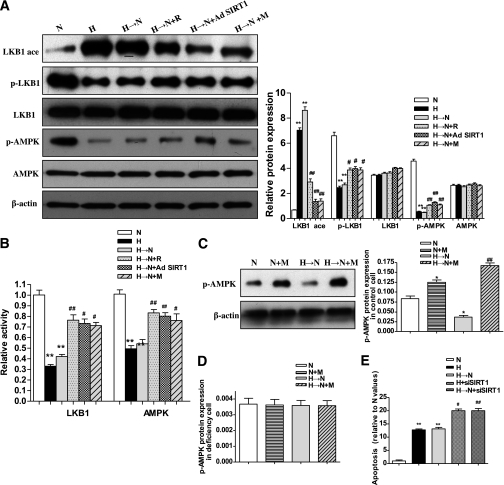
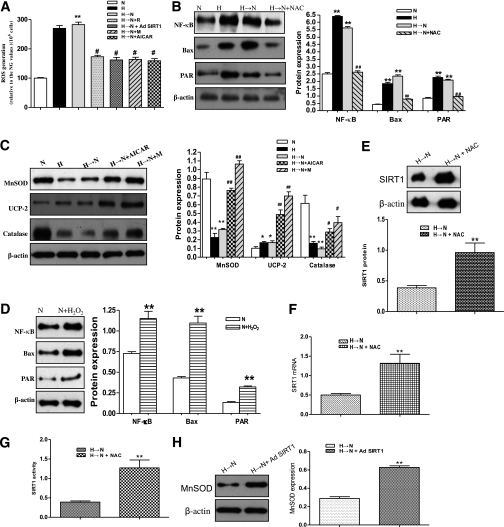
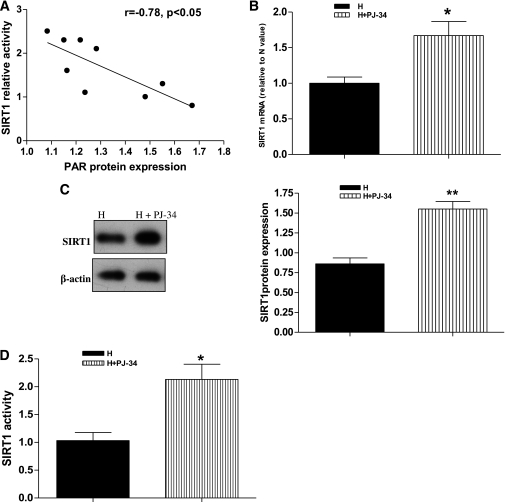
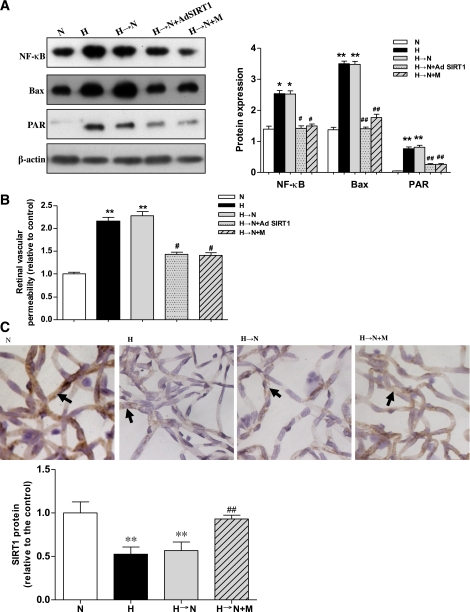
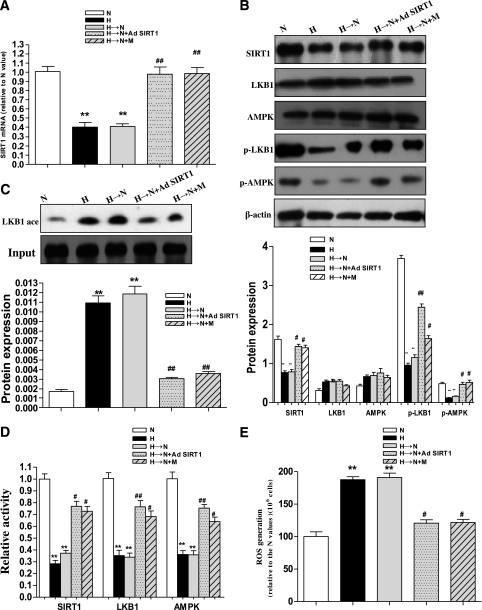
Cellular metabolic memory occurs in diabetic microvascular and macrovascular complications, but the underlying mechanisms remain unclear. Here, we investigate the role of sirtuin 1 (SIRT1) and metformin in this phenomenon. In bovine retinal capillary endothelial cells (BRECs) and retinas of diabetic rats, the inflammatory gene, nuclear factor-κB (NF-κB), and the proapoptotic gene, Bax, induced by hyperglycemia, remained elevated after returning to normoglycemia. BRECs with small interfering RNA-mediated SIRT1 knockdown had increased sensitivity to hyperglycemia stress, whereas SIRT1 overexpression or activation by metformin inhibited the increase of mitochondrial reactive oxygen species-mediated glyceraldehyde-3-phosphate dehydrogenase by poly (ADP-ribose) polymerase (PARP) activity through the upregulation of liver kinase B1/AMP-activated protein kinase (LKB1/AMPK), ultimately suppressing NF-κB and Bax expression. Furthermore, we showed that hyperglycemia led to PARP activation, which in turn may have downregulated SIRT1. Of importance, this study also demonstrated that metformin suppressed the "memory" of hyperglycemia stress in the diabetic retinas, which may be involved in the SIRT1/LKB1/AMPK pathway. Our data suggest that SIRT1 is a potential therapeutic target for the treatment of the cellular metabolic memory, and the use of metformin specifically for such therapy may be a new avenue of investigation in the diabetes field.
Figures
Similar articles
-
Interaction of Nuclear Receptor Subfamily 4 Group A Member 1 (Nr4a1) and Liver Linase B1 (LKB1) Mitigates Type 2 Diabetes Mellitus by Activating Monophosphate-Activated Protein Kinase (AMPK)/Sirtuin 1 (SIRT1) Axis and Inhibiting Nuclear Factor-kappa B (NF-κB) Activation.Med Sci Monit. 2020 Jan 15;26:e920278. doi: 10.12659/MSM.920278. Med Sci Monit. 2020. PMID: 31939452 Free PMC article.
-
Metformin modulates hyperglycaemia-induced endothelial senescence and apoptosis through SIRT1.Br J Pharmacol. 2014 Jan;171(2):523-35. doi: 10.1111/bph.12496. Br J Pharmacol. 2014. PMID: 24372553 Free PMC article.
-
Antagonistic crosstalk between NF-κB and SIRT1 in the regulation of inflammation and metabolic disorders.Cell Signal. 2013 Oct;25(10):1939-48. doi: 10.1016/j.cellsig.2013.06.007. Epub 2013 Jun 11. Cell Signal. 2013. PMID: 23770291 Review.
-
Metformin and tenovin-6 synergistically induces apoptosis through LKB1-independent SIRT1 down-regulation in non-small cell lung cancer cells.J Cell Mol Med. 2019 Apr;23(4):2872-2889. doi: 10.1111/jcmm.14194. Epub 2019 Feb 1. J Cell Mol Med. 2019. PMID: 30710424 Free PMC article.
-
Metformin in cardiovascular diabetology: a focused review of its impact on endothelial function.Theranostics. 2021 Sep 9;11(19):9376-9396. doi: 10.7150/thno.64706. eCollection 2021. Theranostics. 2021. PMID: 34646376 Free PMC article. Review.
Cited by
-
Estrogen Plays a Crucial Role in Rab9-Dependent Mitochondrial Autophagy, Delaying Arterial Senescence.J Am Heart Assoc. 2021 Apr 6;10(7):e019310. doi: 10.1161/JAHA.120.019310. Epub 2021 Mar 15. J Am Heart Assoc. 2021. PMID: 33719502 Free PMC article.
-
MiR-204 down regulates SIRT1 and reverts SIRT1-induced epithelial-mesenchymal transition, anoikis resistance and invasion in gastric cancer cells.BMC Cancer. 2013 Jun 14;13:290. doi: 10.1186/1471-2407-13-290. BMC Cancer. 2013. PMID: 23768087 Free PMC article.
-
Activation of the TXNIP/NLRP3 inflammasome pathway contributes to inflammation in diabetic retinopathy: a novel inhibitory effect of minocycline.Inflamm Res. 2017 Feb;66(2):157-166. doi: 10.1007/s00011-016-1002-6. Epub 2016 Oct 26. Inflamm Res. 2017. PMID: 27785530
-
Resveratrol Prevents GLUT3 Up-Regulation Induced by Middle Cerebral Artery Occlusion.Brain Sci. 2020 Sep 20;10(9):651. doi: 10.3390/brainsci10090651. Brain Sci. 2020. PMID: 32962200 Free PMC article.
-
A Clinical Perspective of the Multifaceted Mechanism of Metformin in Diabetes, Infections, Cognitive Dysfunction, and Cancer.Pharmaceuticals (Basel). 2022 Apr 2;15(4):442. doi: 10.3390/ph15040442. Pharmaceuticals (Basel). 2022. PMID: 35455439 Free PMC article. Review.
References
-
- The Diabetes Control and Complications Trial Research Group. The effect of intensive treatment of diabetes on the development and progression of long-term complications in insulin-dependent diabetes mellitus. N Engl J Med 1993;329:977–986 - PubMed
-
- Nathan DM, Cleary PA, Backlund JY, et al. ; Diabetes Control and Complications Trial/Epidemiology of Diabetes Interventions and Complications (DCCT/EDIC) Study Research Group Intensive diabetes treatment and cardiovascular disease in patients with type 1 diabetes. N Engl J Med 2005;353:2643–2653 - PMC - PubMed
-
- Engerman RL, Kern TS. Progression of incipient diabetic retinopathy during good glycemic control. Diabetes 1987;36:808–812 - PubMed
Publication types
MeSH terms
Substances
LinkOut - more resources
Full Text Sources
Medical
Research Materials
