

Intensive glycaemic control for patients with type 2 diabetes: systematic review with meta-analysis and trial sequential analysis of randomised clinical trials
- PMID: 22115901
- PMCID: PMC3223424
- DOI: 10.1136/bmj.d6898
Intensive glycaemic control for patients with type 2 diabetes: systematic review with meta-analysis and trial sequential analysis of randomised clinical trials
Abstract
Objective: To assess the effect of targeting intensive glycaemic control versus conventional glycaemic control on all cause mortality and cardiovascular mortality, non-fatal myocardial infarction, microvascular complications, and severe hypoglycaemia in patients with type 2 diabetes.
Design: Systematic review with meta-analyses and trial sequential analyses of randomised trials.
Data sources: Cochrane Library, Medline, Embase, Science Citation Index Expanded, LILACS, and CINAHL to December 2010; hand search of reference lists and conference proceedings; contacts with authors, relevant pharmaceutical companies, and the US Food and Drug Administration.
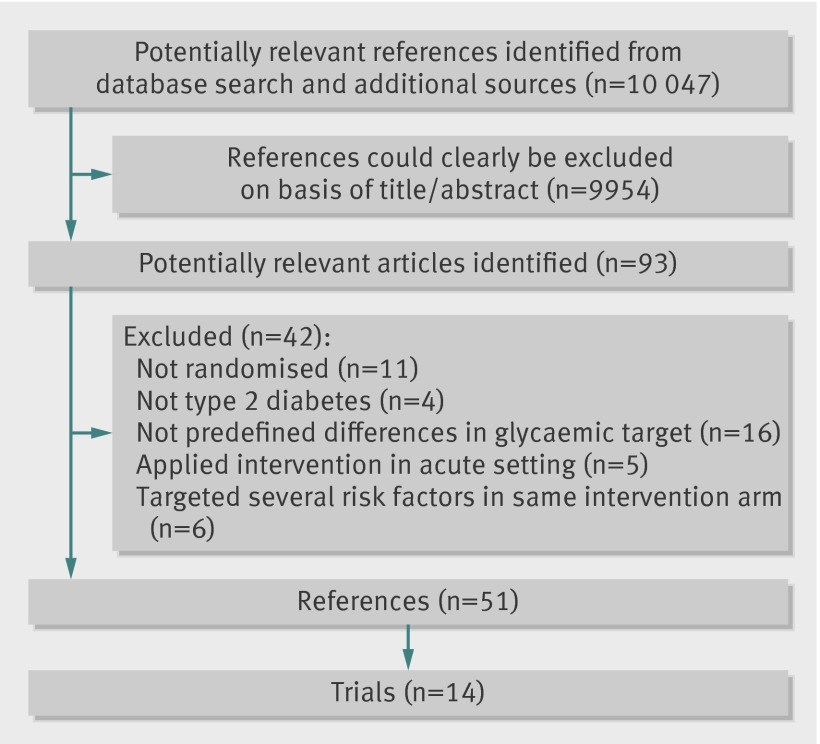
Study selection: Randomised clinical trials comparing targeted intensive glycaemic control with conventional glycaemic control in patients with type 2 diabetes. Published and unpublished trials in all languages were included, irrespective of predefined outcomes.
Data extraction: Two reviewers independently assessed studies for inclusion and extracted data related to study methods, interventions, outcomes, risk of bias, and adverse events. Risk ratios with 95% confidence intervals were estimated with fixed and random effects models.
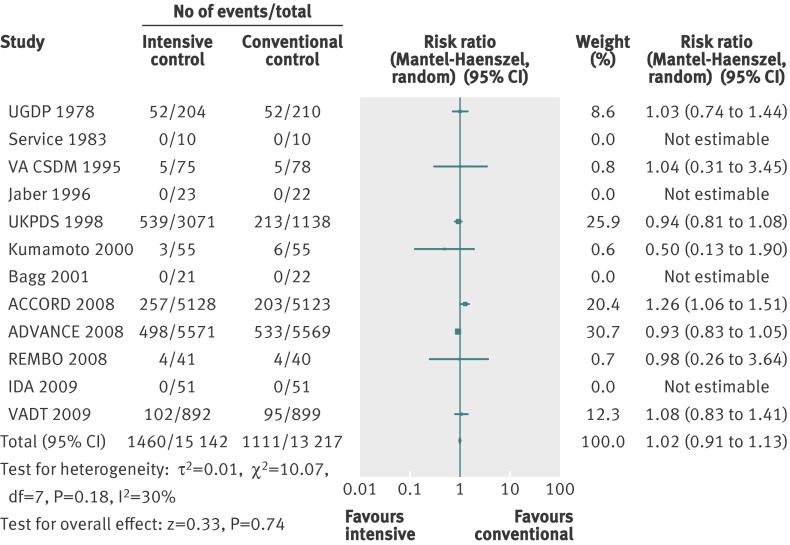
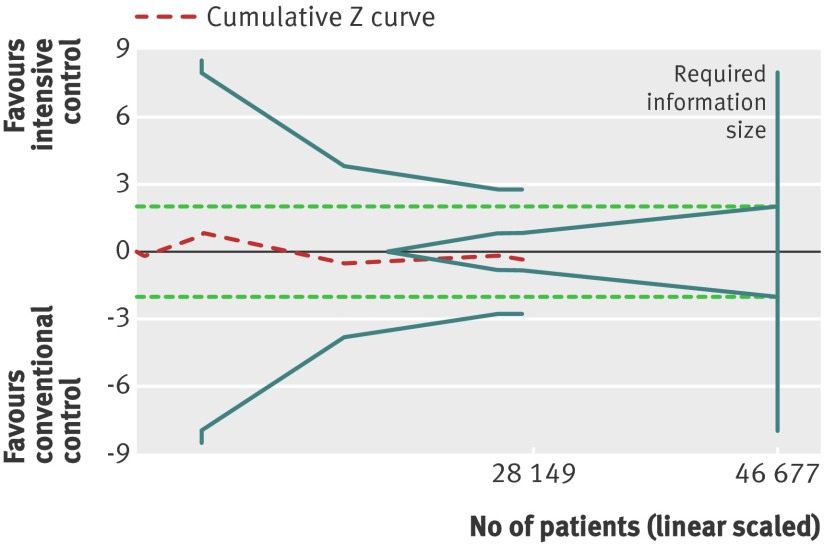
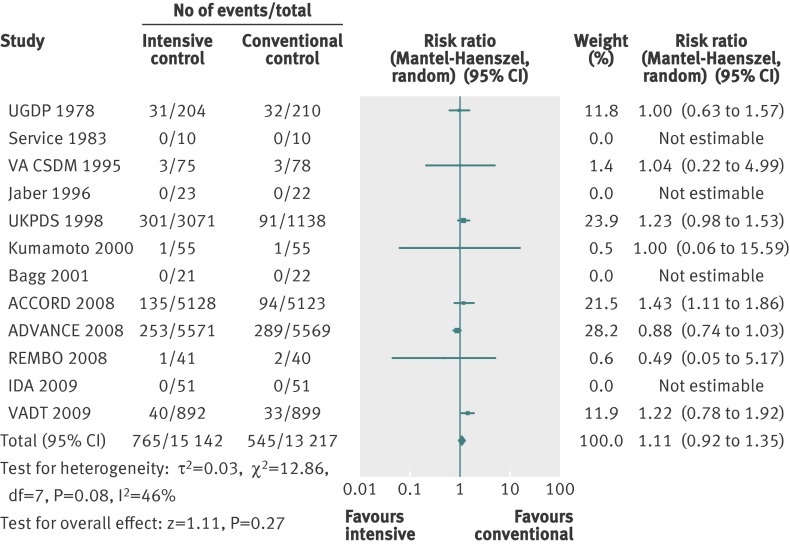
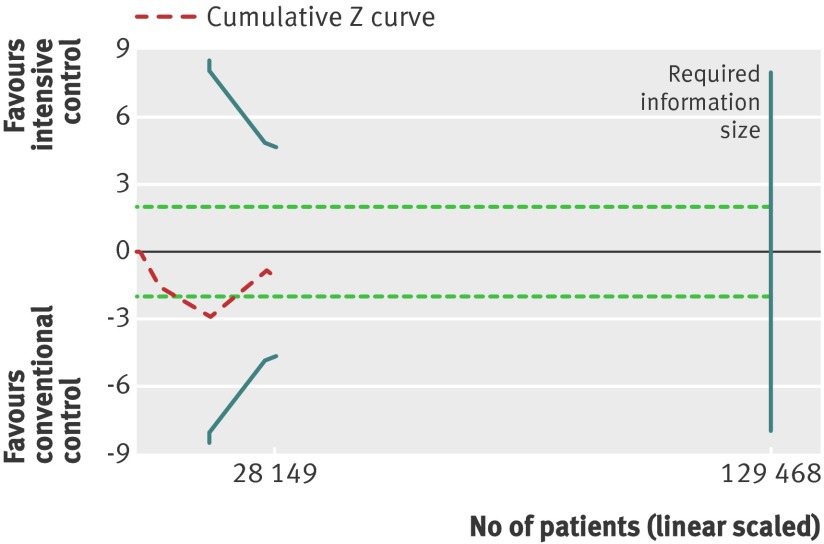
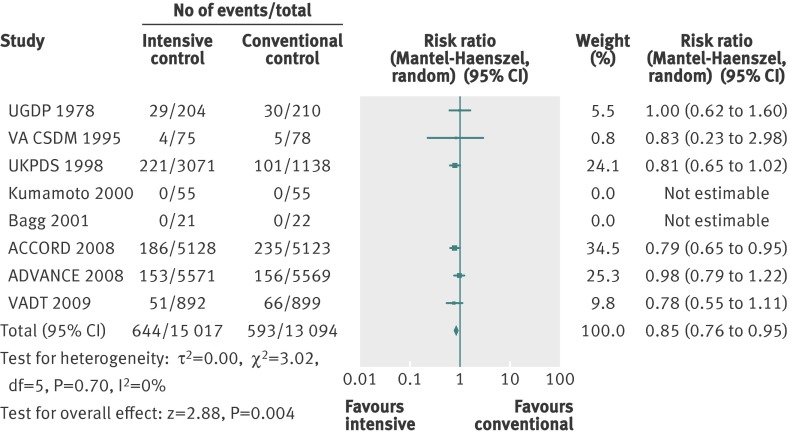
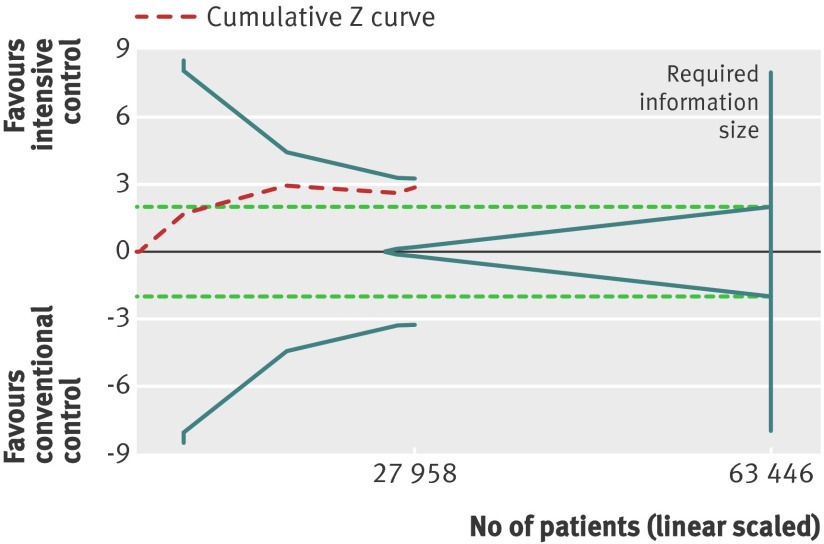
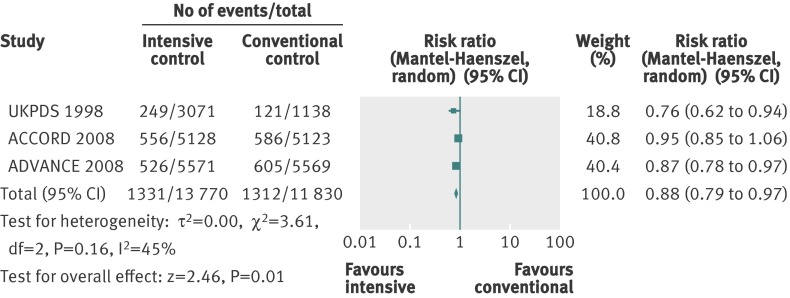
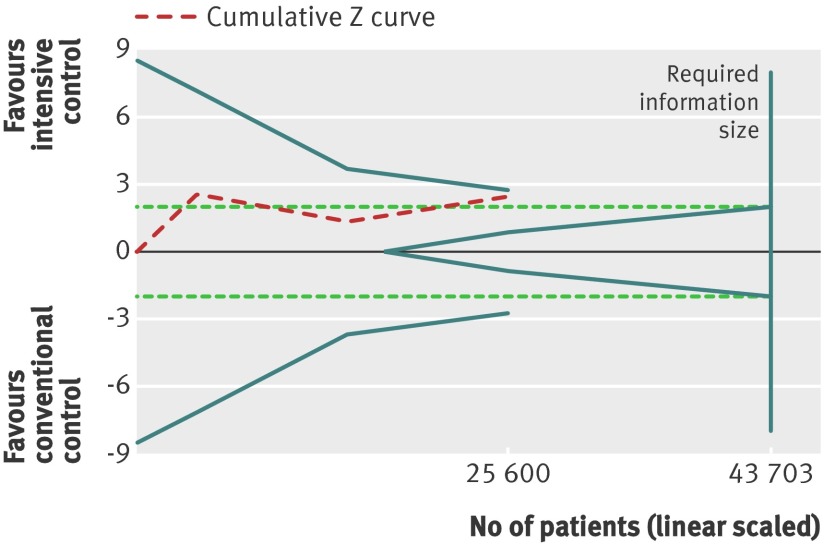
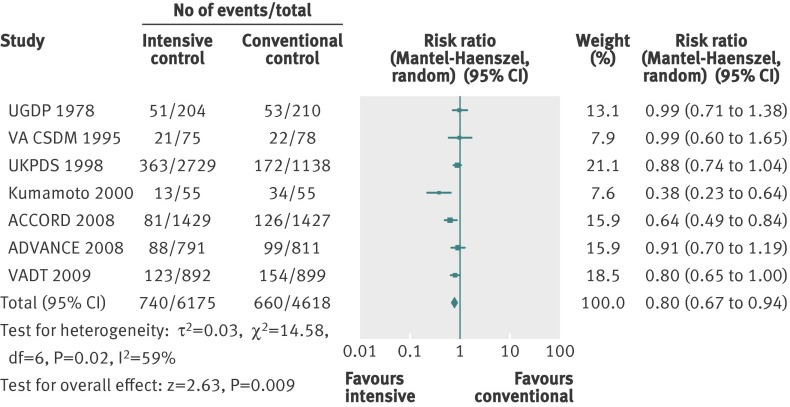
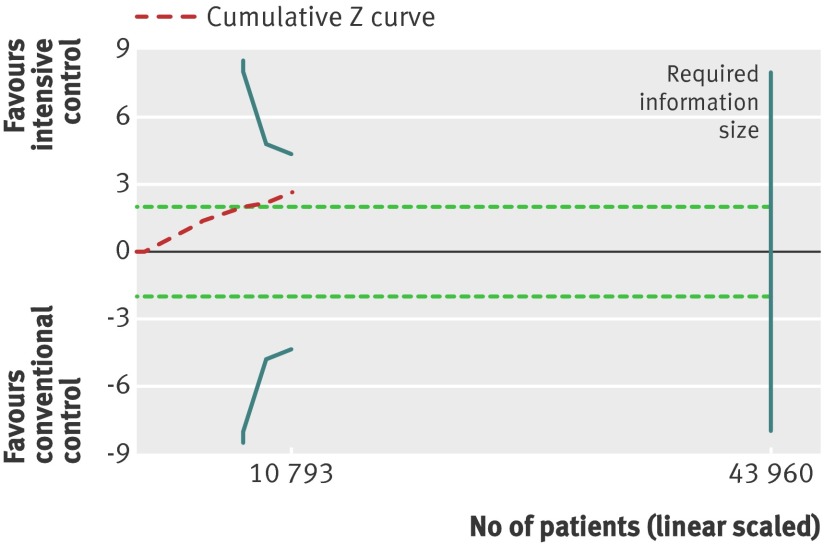
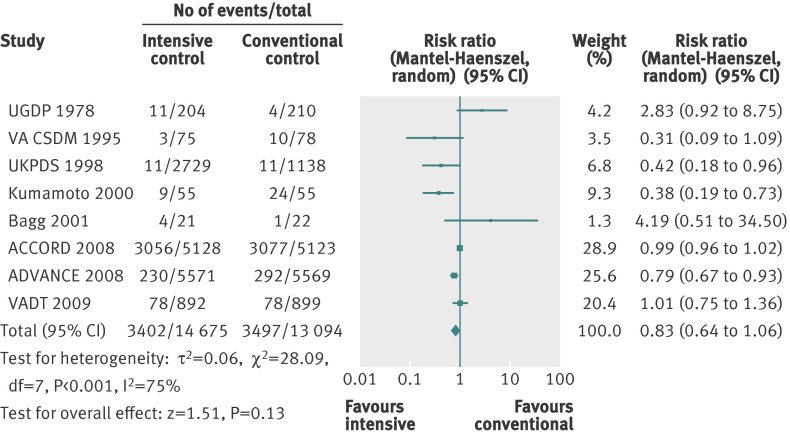
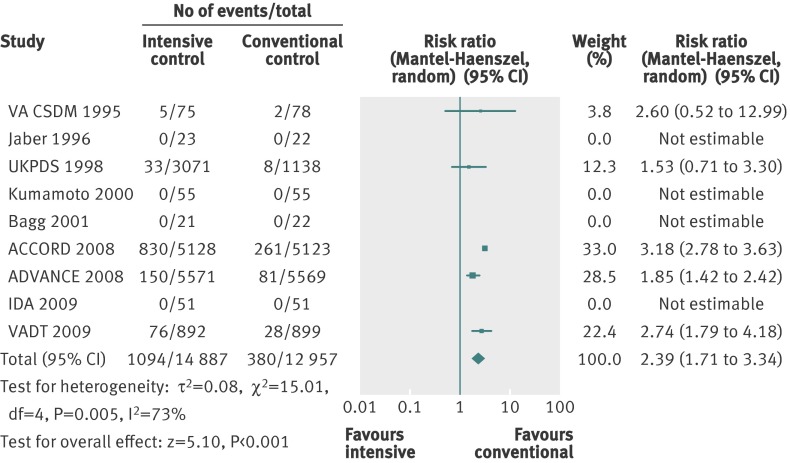
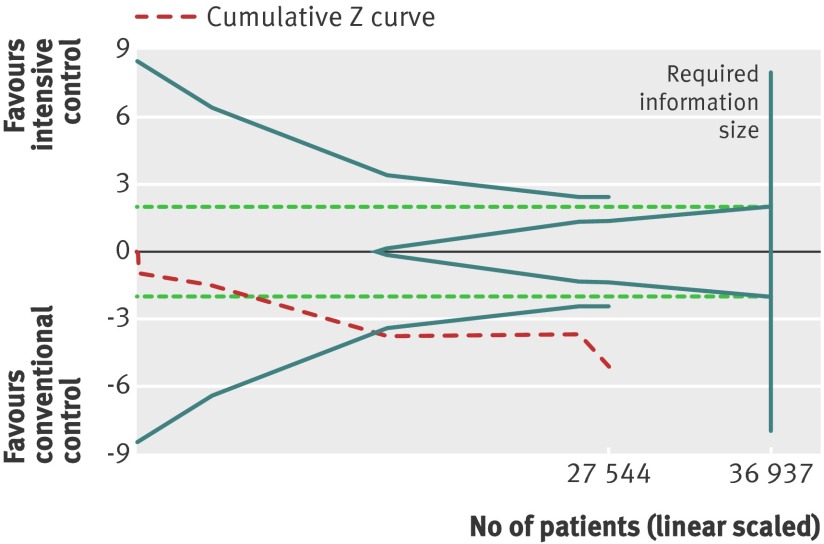
Results: Fourteen clinical trials that randomised 28,614 participants with type 2 diabetes (15,269 to intensive control and 13,345 to conventional control) were included. Intensive glycaemic control did not significantly affect the relative risks of all cause (1.02, 95% confidence interval 0.91 to 1.13; 28,359 participants, 12 trials) or cardiovascular mortality (1.11, 0.92 to 1.35; 28,359 participants, 12 trials). Trial sequential analyses rejected a relative risk reduction above 10% for all cause mortality and showed insufficient data on cardiovascular mortality. The risk of non-fatal myocardial infarction may be reduced (relative risk 0.85, 0.76 to 0.95; P=0.004; 28,111 participants, 8 trials), but this finding was not confirmed in trial sequential analysis. Intensive glycaemic control showed a reduction of the relative risks for the composite microvascular outcome (0.88, 0.79 to 0.97; P=0.01; 25,600 participants, 3 trials) and retinopathy (0.80, 0.67 to 0.94; P=0.009; 10,793 participants, 7 trials), but trial sequential analyses showed that sufficient evidence had not yet been reached. The estimate of an effect on the risk of nephropathy (relative risk 0.83, 0.64 to 1.06; 27,769 participants, 8 trials) was not statistically significant. The risk of severe hypoglycaemia was significantly increased when intensive glycaemic control was targeted (relative risk 2.39, 1.71 to 3.34; 27,844 participants, 9 trials); trial sequential analysis supported a 30% increased relative risk of severe hypoglycaemia.
Conclusion: Intensive glycaemic control does not seem to reduce all cause mortality in patients with type 2 diabetes. Data available from randomised clinical trials remain insufficient to prove or refute a relative risk reduction for cardiovascular mortality, non-fatal myocardial infarction, composite microvascular complications, or retinopathy at a magnitude of 10%. Intensive glycaemic control increases the relative risk of severe hypoglycaemia by 30%.
Conflict of interest statement
Competing interests: All authors have completed the ICMJE uniform disclosure form at
Figures
Comment in
-
Hard end points are needed for intensive glycaemic control in patients with type 2 diabetes.BMJ. 2012 Jan 31;344:e708; author reply e710. doi: 10.1136/bmj.e708. BMJ. 2012. PMID: 22293372 No abstract available.
Similar articles
-
Targeting intensive glycaemic control versus targeting conventional glycaemic control for type 2 diabetes mellitus.Cochrane Database Syst Rev. 2013 Nov 11;(11):CD008143. doi: 10.1002/14651858.CD008143.pub3. Cochrane Database Syst Rev. 2013. Update in: Cochrane Database Syst Rev. 2015 Jul 29;(7):CD008143. doi: 10.1002/14651858.CD008143.pub4. PMID: 24214280 Updated. Review.
-
Targeting intensive glycaemic control versus targeting conventional glycaemic control for type 2 diabetes mellitus.Cochrane Database Syst Rev. 2011 Jun 15;(6):CD008143. doi: 10.1002/14651858.CD008143.pub2. Cochrane Database Syst Rev. 2011. Update in: Cochrane Database Syst Rev. 2013 Nov 11;(11):CD008143. doi: 10.1002/14651858.CD008143.pub3. PMID: 21678374 Updated. Review.
-
Targeting intensive versus conventional glycaemic control for type 1 diabetes mellitus: a systematic review with meta-analyses and trial sequential analyses of randomised clinical trials.BMJ Open. 2014 Aug 19;4(8):e004806. doi: 10.1136/bmjopen-2014-004806. BMJ Open. 2014. PMID: 25138801 Free PMC article. Review.
-
Intensive glucose control versus conventional glucose control for type 1 diabetes mellitus.Cochrane Database Syst Rev. 2014 Feb 14;2014(2):CD009122. doi: 10.1002/14651858.CD009122.pub2. Cochrane Database Syst Rev. 2014. PMID: 24526393 Free PMC article. Review.
-
Sulphonylurea monotherapy for patients with type 2 diabetes mellitus.Cochrane Database Syst Rev. 2013 Apr 30;(4):CD009008. doi: 10.1002/14651858.CD009008.pub2. Cochrane Database Syst Rev. 2013. Update in: Cochrane Database Syst Rev. 2015 Jul 29;(7):CD009008. doi: 10.1002/14651858.CD009008.pub3. PMID: 23633364 Updated. Review.
Cited by
-
The Association Between Sustained HbA1c Control and Long-Term Complications Among Individuals with Type 2 Diabetes: A Retrospective Study.Adv Ther. 2022 May;39(5):2208-2221. doi: 10.1007/s12325-022-02106-4. Epub 2022 Mar 22. Adv Ther. 2022. PMID: 35316502 Free PMC article.
-
The Association Between Leucine and Diabetic Retinopathy in Different Genders: A Cross-Sectional Study in Chinese Patients With Type 2 Diabetes.Front Endocrinol (Lausanne). 2022 Mar 7;13:806807. doi: 10.3389/fendo.2022.806807. eCollection 2022. Front Endocrinol (Lausanne). 2022. PMID: 35321336 Free PMC article.
-
Adding Sodium-Glucose Co-Transporter 2 Inhibitors to Sulfonylureas and Risk of Hypoglycemia: A Systematic Review and Meta-Analysis of Randomized Controlled Trials.Front Endocrinol (Lausanne). 2021 Oct 21;12:713192. doi: 10.3389/fendo.2021.713192. eCollection 2021. Front Endocrinol (Lausanne). 2021. PMID: 34744998 Free PMC article.
-
Mendelian Randomization and Type 2 Diabetes.Cardiovasc Drugs Ther. 2016 Feb;30(1):51-7. doi: 10.1007/s10557-016-6638-5. Cardiovasc Drugs Ther. 2016. PMID: 26809778 Free PMC article. Review.
-
Reverse Translational Study of Fenofibrate's Observed Effects in Diabetes-Associated Retinopathy.Clin Transl Sci. 2017 Mar;10(2):110-116. doi: 10.1111/cts.12412. Epub 2016 Dec 20. Clin Transl Sci. 2017. PMID: 27996196 Free PMC article.
References
-
- Khaw KT, Wareham N. Glycated hemoglobin as a marker of cardiovascular risk. Curr Opin Lipidol 2006;17:637-43. - PubMed
-
- Patel A, MacMahon S, Chalmers J, Neal B, Billot L, Woodward M, et al. Intensive blood glucose control and vascular outcomes in patients with type 2 diabetes. N Engl J Med 2008;358:2560-72. - PubMed
Publication types
MeSH terms
Substances
LinkOut - more resources
Full Text Sources
Medical