Developmental regulation of the late phase of long-term potentiation (L-LTP) and metaplasticity in hippocampal area CA1 of the rat
- PMID: 22114158
- PMCID: PMC3289468
- DOI: 10.1152/jn.00780.2011
Developmental regulation of the late phase of long-term potentiation (L-LTP) and metaplasticity in hippocampal area CA1 of the rat
Abstract
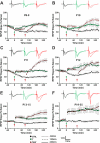
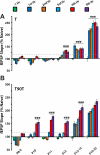
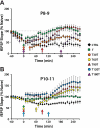
Long-term potentiation (LTP) is a form of synaptic plasticity thought to underlie memory; thus knowing its developmental profile is fundamental to understanding function. Like memory, LTP has multiple phases with distinct timing and mechanisms. The late phase of LTP (L-LTP), lasting longer than 3 h, is protein synthesis dependent and involves changes in the structure and content of dendritic spines, the major sites of excitatory synapses. In previous work, tetanic stimulation first produced L-LTP at postnatal day 15 (P15) in area CA1 of rat hippocampus. Here we used a more robust induction paradigm involving theta-burst stimulation (TBS) in acute slices and found the developmental onset of L-LTP to be 3 days earlier at P12. In contrast, at P8-11, TBS only reversed the synaptic depression that occurs from test-pulse stimulation in developing (P8-15) hippocampus. A second bout of TBS delivered 30-180 min later produced L-LTP at P10-11 but not at P8-9 and enhanced L-LTP at P12-15. Both the developmental onset and the enhanced L-LTP produced by repeated bouts of TBS were blocked by the N-methyl-d-aspartate receptor antagonist dl-2-amino-5-phosphonovaleric acid. Thus the developmental onset age is P12 for L-LTP induced by the more robust and perhaps more naturalistic TBS induction paradigm. Metaplasticity produced by repeated bouts of TBS is developmentally regulated, advancing the capacity for L-LTP from P12 to P10, but not to younger ages. Together these findings provide a new basis from which to investigate mechanisms that regulate the developmental onset of this important form of synaptic plasticity.
Figures

Similar articles
-
In Vivo Plasticity at Hippocampal Schaffer Collateral-CA1 Synapses: Replicability of the LTP Response and Pharmacology in the Long-Evans Rat.Neural Plast. 2020 Nov 12;2020:6249375. doi: 10.1155/2020/6249375. eCollection 2020. Neural Plast. 2020. PMID: 33273904 Free PMC article.
-
Electrical stimuli patterned after the theta-rhythm induce multiple forms of LTP.J Neurophysiol. 2001 Sep;86(3):1289-96. doi: 10.1152/jn.2001.86.3.1289. J Neurophysiol. 2001. PMID: 11535677
-
Theta burst stimulation-induced LTP: Differences and similarities between the dorsal and ventral CA1 hippocampal synapses.Hippocampus. 2016 Dec;26(12):1542-1559. doi: 10.1002/hipo.22655. Epub 2016 Oct 3. Hippocampus. 2016. PMID: 27650481
-
NMDA receptor-dependent long-term potentiation comprises a family of temporally overlapping forms of synaptic plasticity that are induced by different patterns of stimulation.Philos Trans R Soc Lond B Biol Sci. 2013 Dec 2;369(1633):20130131. doi: 10.1098/rstb.2013.0131. Print 2014 Jan 5. Philos Trans R Soc Lond B Biol Sci. 2013. PMID: 24298134 Free PMC article. Review.
-
Long-term potentiation and long-term depression of horizontal connections in rat motor cortex.Acta Neurobiol Exp (Wars). 1996;56(1):397-405. doi: 10.55782/ane-1996-1143. Acta Neurobiol Exp (Wars). 1996. PMID: 8787200 Review.
Cited by
-
Structural Components of Synaptic Plasticity and Memory Consolidation.Cold Spring Harb Perspect Biol. 2015 Jul 1;7(7):a021758. doi: 10.1101/cshperspect.a021758. Cold Spring Harb Perspect Biol. 2015. PMID: 26134321 Free PMC article. Review.
-
Postweaning Development Influences Endogenous VPAC1 Modulation of LTP Induced by Theta-Burst Stimulation: A Link to Maturation of the Hippocampal GABAergic System.Biomolecules. 2024 Mar 20;14(3):379. doi: 10.3390/biom14030379. Biomolecules. 2024. PMID: 38540797 Free PMC article.
-
Effect of 30 Hz theta burst transcranial magnetic stimulation on the primary motor cortex in children and adolescents.Front Hum Neurosci. 2015 Feb 25;9:91. doi: 10.3389/fnhum.2015.00091. eCollection 2015. Front Hum Neurosci. 2015. PMID: 25762919 Free PMC article.
-
Functional Metaplasticity of Hippocampal Schaffer Collateral-CA1 Synapses Is Reversed in Chronically Epileptic Rats.Neural Plast. 2017;2017:8087401. doi: 10.1155/2017/8087401. Epub 2017 Oct 2. Neural Plast. 2017. PMID: 29098091 Free PMC article.
-
Alzheimer brain-derived tau oligomers propagate pathology from endogenous tau.Sci Rep. 2012;2:700. doi: 10.1038/srep00700. Epub 2012 Oct 3. Sci Rep. 2012. PMID: 23050084 Free PMC article.
References
-
- Abraham WC, Bear MF. Metaplasticity: the plasticity of synaptic plasticity. Trends Neurosci 19: 126–130, 1996 - PubMed
-
- Abraham WC, Huggett A. Induction, and reversal of long-term potentiation by repeated high-frequency stimulation in rat hippocampal slices. Hippocampus 7: 137–145, 1997 - PubMed
-
- Abrahamsson T, Gustafsson B, Hanse E. Reversible synaptic depression in developing rat CA3 and CA1 synapses explained by a novel cycle of AMPA silencing-unsilencing. J Neurophysiol 98: 2604–2611, 2007 - PubMed
-
- Abrahamsson T, Gustafsson B, Hanse E. AMPA silencing is a prerequisite for developmental long-term potentiation in the hippocampal CA1 region. J Neurophysiol 100: 2605–2614, 2008 - PubMed
Publication types
MeSH terms
Substances
Grants and funding
LinkOut - more resources
Full Text Sources
Other Literature Sources
Miscellaneous

