

Metabolic adaptation to a high-fat diet is associated with a change in the gut microbiota
- PMID: 22110050
- PMCID: PMC3292714
- DOI: 10.1136/gutjnl-2011-301012
Metabolic adaptation to a high-fat diet is associated with a change in the gut microbiota
Abstract
Objective: The gut microbiota, which is considered a causal factor in metabolic diseases as shown best in animals, is under the dual influence of the host genome and nutritional environment. This study investigated whether the gut microbiota per se, aside from changes in genetic background and diet, could sign different metabolic phenotypes in mice.
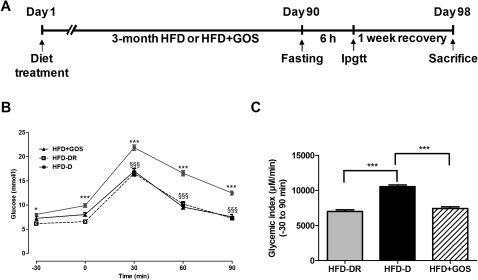
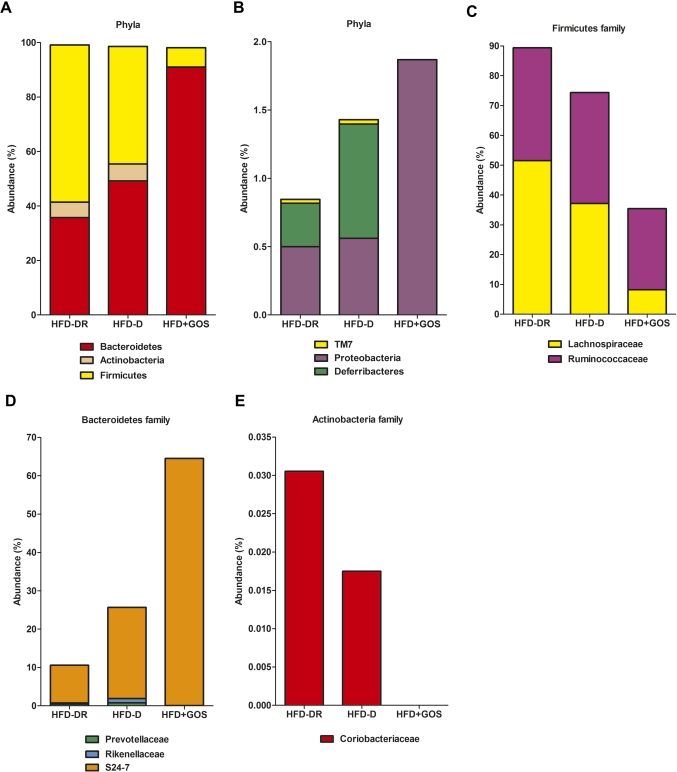
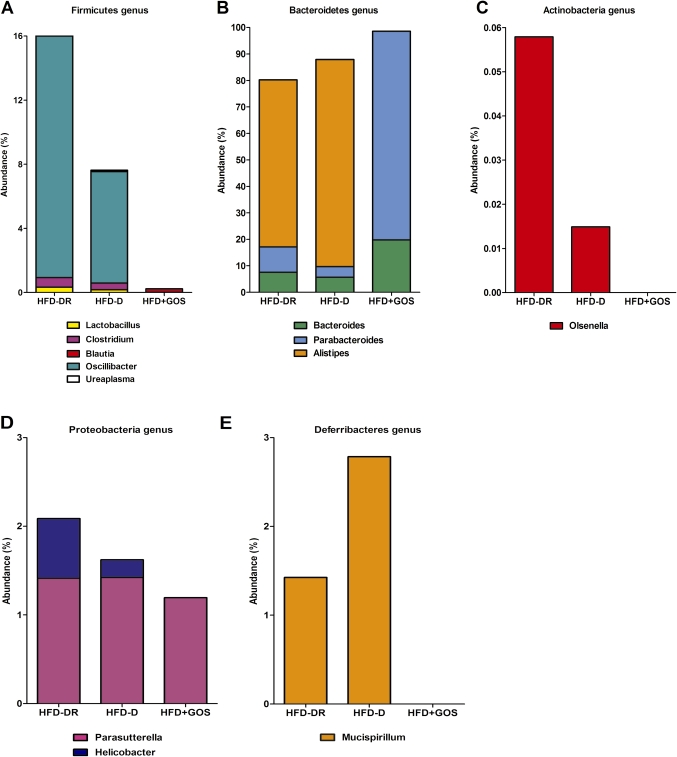
Methods: The unique animal model of metabolic adaptation was used, whereby C57Bl/6 male mice fed a high-fat carbohydrate-free diet (HFD) became either diabetic (HFD diabetic, HFD-D) or resisted diabetes (HFD diabetes-resistant, HFD-DR). Pyrosequencing of the gut microbiota was carried out to profile the gut microbial community of different metabolic phenotypes. Inflammation, gut permeability, features of white adipose tissue, liver and skeletal muscle were studied. Furthermore, to modify the gut microbiota directly, an additional group of mice was given a gluco-oligosaccharide (GOS)-supplemented HFD (HFD+GOS).
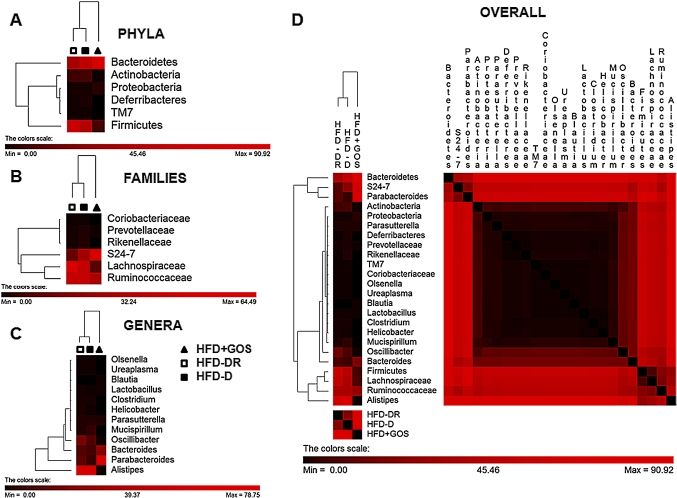
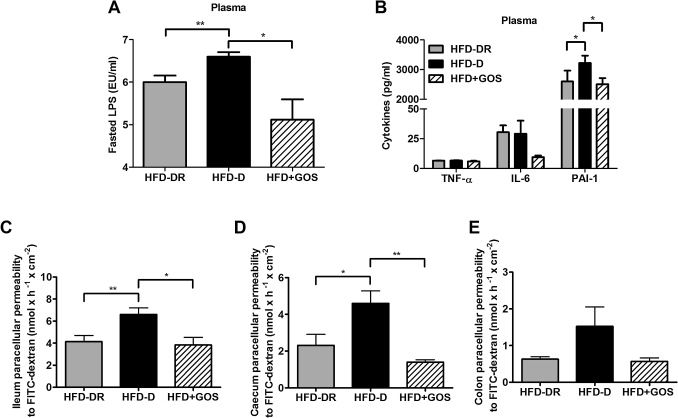
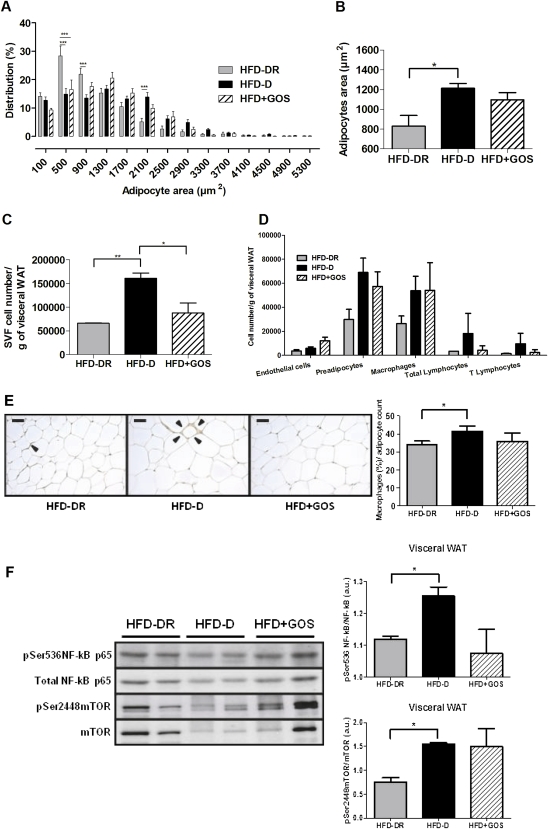
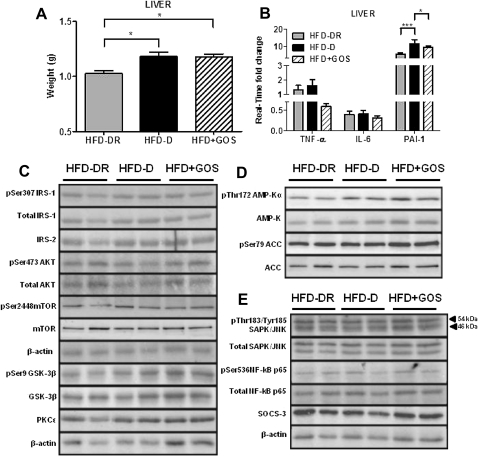
Results: Despite the mice having the same genetic background and nutritional status, a gut microbial profile specific to each metabolic phenotype was identified. The HFD-D gut microbial profile was associated with increased gut permeability linked to increased endotoxaemia and to a dramatic increase in cell number in the stroma vascular fraction from visceral white adipose tissue. Most of the physiological characteristics of the HFD-fed mice were modulated when gut microbiota was intentionally modified by GOS dietary fibres.
Conclusions: The gut microbiota is a signature of the metabolic phenotypes independent of differences in host genetic background and diet.
Conflict of interest statement
Figures
Comment in
-
Too much fat for the gut's microbiota.Gut. 2012 Apr;61(4):474-5. doi: 10.1136/gutjnl-2011-301918. Epub 2012 Jan 20. Gut. 2012. PMID: 22267594 No abstract available.
Similar articles
-
Improvement in glucose tolerance and insulin sensitivity by probiotic strains of Indian gut origin in high-fat diet-fed C57BL/6J mice.Eur J Nutr. 2018 Feb;57(1):279-295. doi: 10.1007/s00394-016-1317-7. Epub 2016 Oct 18. Eur J Nutr. 2018. PMID: 27757592
-
Serum endotoxin, gut permeability and skeletal muscle metabolic adaptations following a short term high fat diet in humans.Metabolism. 2020 Feb;103:154041. doi: 10.1016/j.metabol.2019.154041. Epub 2019 Nov 28. Metabolism. 2020. PMID: 31785256 Clinical Trial.
-
Effects of dietary fat profile on gut permeability and microbiota and their relationships with metabolic changes in mice.Obesity (Silver Spring). 2015 Jul;23(7):1429-39. doi: 10.1002/oby.21122. Epub 2015 Jun 5. Obesity (Silver Spring). 2015. PMID: 26053244
-
Managing the manager: gut microbes, stem cells and metabolism.Diabetes Metab. 2014 Jun;40(3):186-90. doi: 10.1016/j.diabet.2013.12.004. Epub 2014 Jan 23. Diabetes Metab. 2014. PMID: 24462190 Review.
-
Exploring a novel therapeutic strategy: the interplay between gut microbiota and high-fat diet in the pathogenesis of metabolic disorders.Front Nutr. 2023 Dec 15;10:1291853. doi: 10.3389/fnut.2023.1291853. eCollection 2023. Front Nutr. 2023. PMID: 38192650 Free PMC article. Review.
Cited by
-
Towards a more comprehensive concept for prebiotics.Nat Rev Gastroenterol Hepatol. 2015 May;12(5):303-10. doi: 10.1038/nrgastro.2015.47. Epub 2015 Mar 31. Nat Rev Gastroenterol Hepatol. 2015. PMID: 25824997 Review.
-
GH13 amylosucrases and GH70 branching sucrases, atypical enzymes in their respective families.Cell Mol Life Sci. 2016 Jul;73(14):2661-79. doi: 10.1007/s00018-016-2244-8. Epub 2016 May 3. Cell Mol Life Sci. 2016. PMID: 27141938 Free PMC article. Review.
-
Mucosal-associated invariant T cells promote inflammation and intestinal dysbiosis leading to metabolic dysfunction during obesity.Nat Commun. 2020 Jul 24;11(1):3755. doi: 10.1038/s41467-020-17307-0. Nat Commun. 2020. PMID: 32709874 Free PMC article.
-
Changes in gut microbiota in rats fed a high fat diet correlate with obesity-associated metabolic parameters.PLoS One. 2015 May 18;10(5):e0126931. doi: 10.1371/journal.pone.0126931. eCollection 2015. PLoS One. 2015. PMID: 25992554 Free PMC article.
-
Liver Steatosis, Gut-Liver Axis, Microbiome and Environmental Factors. A Never-Ending Bidirectional Cross-Talk.J Clin Med. 2020 Aug 14;9(8):2648. doi: 10.3390/jcm9082648. J Clin Med. 2020. PMID: 32823983 Free PMC article. Review.
References
-
- Roberfroid MB. Inulin-type fructans: functional food ingredients. J Nutr 2007;137(11 Suppl):2493S–502S - PubMed
-
- Burcelin R, Luche E, Serino M, et al. The gut microbiota ecology: a new opportunity for the treatment of metabolic diseases? Front Biosci 2009;14:5107–17 - PubMed
-
- Cani PD, Bibiloni R, Knauf C, et al. Changes in gut microbiota control metabolic endotoxemia-induced inflammation in high-fat diet-induced obesity and diabetes in mice. Diabetes 2008;57:1470–81 - PubMed
-
- Membrez M, Blancher F, Jaquet M, et al. Gut microbiota modulation with norfloxacin and ampicillin enhances glucose tolerance in mice. Faseb J 2008;22:2416–26 - PubMed
Publication types
MeSH terms
Substances
LinkOut - more resources
Full Text Sources
Other Literature Sources