. 2012 Jan;26(1):37-51.
doi: 10.1210/me.2011-1109. Epub 2011 Nov 22.

VDR/RXR and TCF4/β-catenin cistromes in colonic cells of colorectal tumor origin: impact on c-FOS and c-MYC gene expression

Affiliations

VDR/RXR and TCF4/β-catenin cistromes in colonic cells of colorectal tumor origin: impact on c-FOS and c-MYC gene expression

Mark B Meyer et al. Mol Endocrinol. 2012 Jan.

Abstract

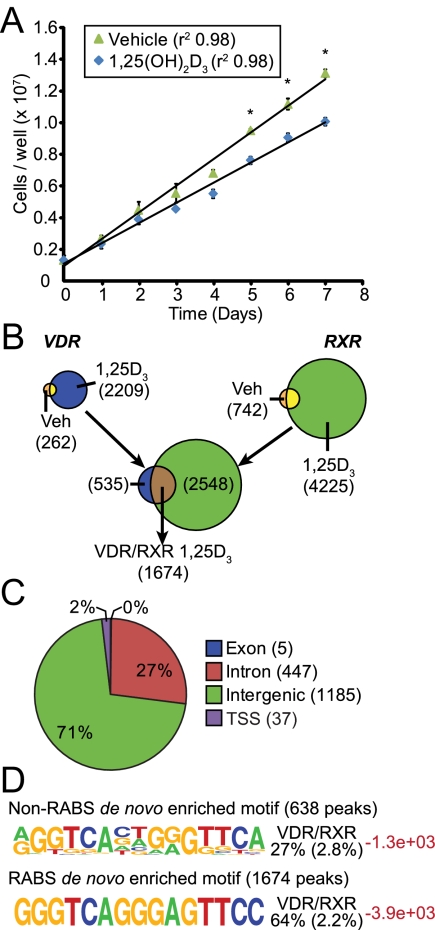
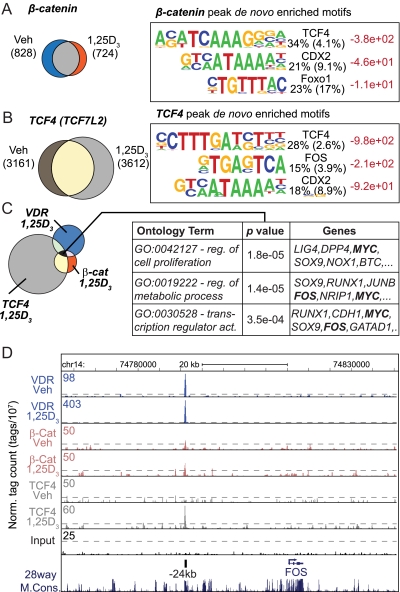
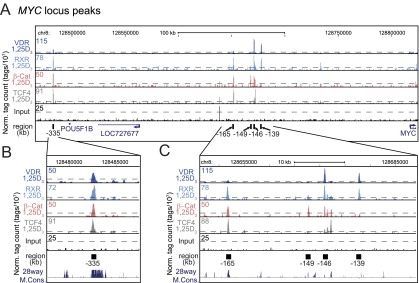
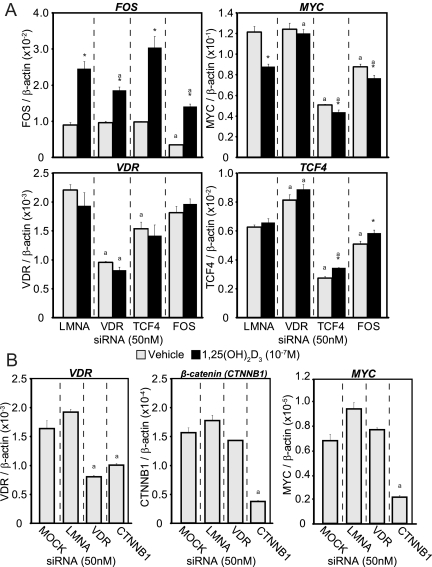
Many of the transcriptional and growth regulating activities of 1α,25-dihydroxyvitamin D(3) [1,25-(OH)(2)D(3)] in the intestine and colon are recapitulated in the human colorectal cancer cell LS180. We therefore used this line together with chromatin immunoprecipitation-seq and gene expression analyses to identify the vitamin D receptor (VDR)/retinoid X receptor (RXR) and transcription factor 7-like 2 (TCF7L2/TCF4)/β-catenin cistromes and the genes that they regulate. VDR and RXR colocalized to predominantly promoter distal, vitamin D response element-containing sites in a largely ligand-dependent manner. These regulatory sites control the expression of both known as well as novel 1,25-(OH)(2)D(3) target genes. TCF4 and β-catenin cistromes partially overlapped, contained TCF/lymphoid enhancer-binding factor consensus elements, and were only modestly influenced by 1,25-(OH)(2)D(3). However, the two heterodimer complexes colocalized at sites near a limited set of genes that included c-FOS and c-MYC; the expression of both genes was modulated by 1,25-(OH)(2)D(3). At the c-FOS gene, both VDR/RXR and TCF4/β-catenin bound to a single distal enhancer located 24 kb upstream of the transcriptional start site. At the c-MYC locus, however, binding was noted at a cluster of sites between -139 and -165 kb and at a site located -335 kb upstream. Examined as isolated enhancer fragments, these regions exhibited basal and 1,25-(OH)(2)D(3)-inducible activities that were interlinked to both VDR and β-catenin activation. These data reveal additional complexity in the regulation of target genes by 1,25-(OH)(2)D(3) and support a direct action of both VDR and the TCF4/β-catenin regulatory complex at c-FOS and c-MYC.


Figures

Fig. 1.
Fig. 1.
1,25-(OH)2D3 activation of VDR and RXR defines the transcriptional cistrome. A, LS180 cells are growth inhibited after treatment with 1,25-(OH)2D3. Cells were grown in culture with ethanol vehicle (green triangles) or 10−7 m 1,25-(OH)2D3 (blue diamonds) for 7 d in culture. Data are displayed from a triplicate analysis ± sem (*, P < 0.05). B, The VDR and RXR binding sites are depicted schematically as Venn diagrams with the diagram size proportional to the number of sites discovered in parentheses. The VDR+1,25-(OH)2D3 (1,25D3) (2209) and RXR+1,25-(OH)2D3 (1,25D3) (4225) peaks yielded an overlap of 1674 peaks in direct contact with each other and are listed as VDR/RXR 1,25D3. C, Peaks were annotated to the hg18 genome to the nearest gene promoter and defined as intragenic (exon, intron), promoter (within −500/+500 bp), or intergenic (>−500 bp or any distance downstream of 3′-untranslated region). D, HOMER analysis revealed the top de novo enriched motifs (frequency logos) in the VDR/RXR peaks associated with RABS (bottom) or NRABS. Each logo is accompanied by the percent enrichment within the peak population compared with sequence enrichment in 50,000 random sequences (in parentheses). Log P values are provided in red. Veh, Vehicle.
Fig. 2.
Fig. 2.
The PADI locus is regulated by novel VDR/RXR binding. A, The PADI locus is comprised of all PADI genes within a 350-kb region (chr1: 17,257,762–17,609,924). ChIP-seq tag density profiles for VDR-1,25D3, RXR-1,25D3, and input in the presence of 1,25-(OH)2D3 are displayed centered around the PADI1 and PADI3 genomic locus (chr1: 17,400,675–17,469,931) with gene transcriptional direction indicated by the arrow. The ChIP-seq tag densities have been normalized to 1 × 10⁷ tags with the tag maximum for the data depicted on the top left of each track. FDR threshold of 0.001 is represented as a dashed line for each tag density track. The major peak of VDR/RXR binding occurs within an intron of PADI1. B, LS180 cells were treated with increasing concentrations of 1,25-(OH)2D3 (10−9 to 10−7) or ethanol vehicle (V) for 24 h. RNA was reverse transcribed and analyzed by qPCR for PADI1, PADI2, PADI3, PADI4, and PADI6 and displayed as fold change over vehicle. Each point was averaged and normalized to β-actin ± sem for a triplicate set of assays. *, P < 0.05 as compared with vehicle treatment. C, DNA fragments (400–600 bp) containing either the TRPV6 −2.1 kb and −4.3 kb regions, control regions around the PADI1 promoter (1-PRO), PADI3 promoter (3-PRO) or the full peak region (A/B) as well as partial A or B regions were cloned into the pTK-luciferase (tkluc) reporter vector and were evaluated for transcriptional activity in LS180 cells after treatment for 16 h with either ethanol vehicle (V) or 1,25-(OH)2D3 (10−9 to 10−7 m). Each point represents the relative light unit average normalized to β-gal ± sem for a triplicate set of assays. *, P < 0.05 as compared with vehicle treatment within construct. a, P < 0.05 to determine differences in basal levels as compared with vehicle treatment of 1-PRO and 3-PRO constructs. These results are representative of at least three similar experiments. chr, Chromosome; Norm, normalized.
Fig. 3.
Fig. 3.
β-Catenin and TCF4 cistrome analysis. A, Cistrome analysis of β-catenin reveals 828 peaks in the untreated and 724 in the 1,25-(OH)2D3-treated state; 431 peaks overlap as displayed by Venn diagram (left). The β-catenin peaks were interrogated with the HOMER analysis for de novo motif discovery. Each logo is displayed as in Fig. 1D. B, Cistrome analysis of TCF4 reveals 3161 peaks in the untreated and 3612 in the 1,25-(OH)2D3-treated state; 2026 peaks overlap as displayed by Venn diagram (left). The TCF4 peaks were interrogated by HOMER analysis for de novo motif discovery. Each logo is displayed as in Fig. 1D. C, Cistrome analysis of TCF4, β-catenin, and VDR was performed and the peak overlaps were displayed by Venn diagram (left). Seventy four peaks were common to VDR, TCF4, and β-catenin (black) and annotated to the nearest gene promoters. Gene Ontology (GO) analysis was performed on the annotated set of genes from the 74 peaks. A few of the top enriched GO terms are displayed (left). The Gene Ontology (GO) terms (reg.. regulation; act., activation) (left), P values (center), and associated genes (right) are listed. D, ChIP-seq tag density profiles for VDR (Veh, 1,25D3), β-catenin (β-cat) (Veh, 1,25D3), TCF4 (Veh, 1,25D3) and input centered on the c-FOS genomic locus (chr14: 74,762,115–74,840,552) are displayed with the direction of transcription indicated by the arrow. The ChIP-seq tag densities are normalized to 1 × 10⁷ tags with the tag maximum for the data depicted on the top left of each track. FDR threshold of 0.001 is represented as a dashed line for each tag density track. The major peak of VDR/RXR binding is annotated at −24 kb upstream of the c-FOS TSS. Chr, Chromosome; Veh, vehicle.
Fig. 4.
Fig. 4.
VDR/RXR, β-catenin, and TCF4 colocalize to the −335 kb region as well as to a novel region approximately −145 kb from the c-MYC gene. A, ChIP-seq tag density profiles for VDR-1,25D3, RXR-1,25D3, β-catenin-1,25D3, TCF4–1,25D3, and input are centered on the c-MYC genomic locus (chr8: 128,451,376–128,834,335) and displayed with the direction of gene transcription indicated by the arrow. The ChIP-seq tag densities have been normalized to 1 × 10⁷ tags with the tag maximum for the data depicted on the top left of each track. FDR threshold of 0.001 is represented as a dashed line for each tag density track. B, Focused view of the −335 kb c-MYC binding region (chr8: 128,478,500–128,487,500). The −335 kb region is annotated as a black box. C, Focused view of the −145 kb c-MYC binding region (chr8: 128,646, 218–128,689,044). The binding regions −165 kb, −149 kb, −146 kb, and −139 kb are annotated by black boxes. Chr, Chromosome; Norm, normalized; β-Cat, β-catenin.
Fig. 5.
Fig. 5.
Knockdown via siRNAs decreases the 1,25-(OH)2D3-mediated effect on c-MYC transcription. A, siRNA for Lamin A (LMNA, control), VDR, TCF4, or c-FOS (50 nm) were transfected into LS180 cells and 48 h later treated for an additional 24 h with ethanol vehicle (gray) or 1,25-(OH)2D3 (10−7m, black) in triplicate. RNA was reverse transcribed and analyzed by qPCR for c-FOS, c-MYC, VDR, and TCF4. *, P < 0.05 as compared with vehicle treatment within same siRNA. a, P < 0.05 as compared with LMNA control levels within the same treatment. These results are representative of at least three similar experiments. B, An independent experiment was performed to determine the basal contributions of β-catenin to each gene. siRNA for mock (no RNA control), Lamin A (LMNA, control), VDR, or β-catenin (50 nm) were transfected into LS180 cells and 48 h later treated for an additional 24 h with ethanol vehicle (gray) in triplicate. RNA was reverse transcribed and analyzed by qPCR for VDR, c-MYC, and β-catenin expression. a, P < 0.05 as compared with LMNA control levels within the same treatment. These results are representative of at least three similar experiments.
Fig. 6.
Fig. 6.
Novel c-MYC regions contain transcriptional activity that is selectively abrogated after mutation at potential TCF4 and VDR response elements. A, DNA fragments (400–600 bp) containing either the TRPV6 −2.1 kb and −4.3 kb regions, control regions around the c-MYC promoter (Pro), c-MYC upstream regions (−139, −146, −149, −165, −335), c-FOS promoter (PRO) and c-FOS −24 kb upstream region were cloned into the pTK-luciferase (tkluc) reporter vector and were evaluated for transcriptional activity in LS180 cells after treatment for 16 h with either ethanol vehicle (V) or 1,25-(OH)2D3 (10−9 to 10−7 m). Each point represents the relative light unit average normalized to β-gal ± sem for a triplicate set of assays. *, P < 0.05 compared with vehicle treatment within each construct. a, P < 0.05 to determine differences in basal levels compared with vehicle treatment of c-MYC Pro or c-FOS PRO constructs, respectively. These results are representative of at least three similar experiments. B, Mutations were introduced in the c-MYC region constructs at −146 kb (chr8: 128,670,964–128,671,012), −165 kb (chr8: 128,651,782–128,651,900), and −335 kb (chr8: 128,482,449–128,482,497). All genomic locations are based on the hg18 genomic build. The sequences listed are the wild-type gene. Underlined portions of the sequence were mutated to TTT nucleotides in all cases except c-MYC-146-VDRE2 (mutated to CCC). C, Point mutations were created in the corresponding wild-type (wt) pTK-luciferase (tkluc) reporter vector and were evaluated for transcriptional activity in LS180 cells after treatment for 16 h with either ethanol vehicle (V) or 1,25-(OH)2D3 (10−7 m). Each point represents the relative light unit average normalized to β-gal ± sem for a triplicate set of assays. *, P < 0.05 compared with vehicle treatment within each construct. a, P < 0.05 to determine differences in basal levels as compared with vehicle treatment of c-MYC Pro. #, P < 0.05 compared with wild-type (wt) condition. These results are representative of at least three similar experiments. chr, Chromosome.

Similar articles

Cited by

References

    1. Plum LA, DeLuca HF. 2010. Vitamin D, disease and therapeutic opportunities. Nat Rev Drug Discov 9:941–955 - PubMed
    1. Bikle DD. 2010. Vitamin D and the skin. J Bone Miner Metab 28:117–130 - PubMed
    1. Deeb KK, Trump DL, Johnson CS. 2007. Vitamin D signalling pathways in cancer: potential for anticancer therapeutics. Nat Rev Cancer 7:684–700 - PubMed
    1. Welsh J. 2004. Vitamin D and breast cancer: insights from animal models. Am J Clin Nutr 80:1721S–1724S - PubMed
    1. Ellison TI, Smith MK, Gilliam AC, MacDonald PN. 2008. Inactivation of the vitamin D receptor enhances susceptibility of murine skin to UV-induced tumorigenesis. J Invest Dermatol 128:2508–2517 - PMC - PubMed

Publication types

MeSH terms