Comparative Study
. 2012 Jan 18;31(2):330-50.
doi: 10.1038/emboj.2011.406. Epub 2011 Nov 15.

Human tRNA genes function as chromatin insulators

Affiliations
Comparative Study

Human tRNA genes function as chromatin insulators

Jesse R Raab et al. EMBO J. .

Abstract

Insulators help separate active chromatin domains from silenced ones. In yeast, gene promoters act as insulators to block the spread of Sir and HP1 mediated silencing while in metazoans most insulators are multipartite autonomous entities. tDNAs are repetitive sequences dispersed throughout the human genome and we now show that some of these tDNAs can function as insulators in human cells. Using computational methods, we identified putative human tDNA insulators. Using silencer blocking, transgene protection and repressor blocking assays we show that some of these tDNA-containing fragments can function as barrier insulators in human cells. We find that these elements also have the ability to block enhancers from activating RNA pol II transcribed promoters. Characterization of a putative tDNA insulator in human cells reveals that the site possesses chromatin signatures similar to those observed at other better-characterized eukaryotic insulators. Enhanced 4C analysis demonstrates that the tDNA insulator makes long-range chromatin contacts with other tDNAs and ETC sites but not with intervening or flanking RNA pol II transcribed genes.


Conflict of interest statement

The authors declare that they have no conflict of interest.

Figures

Figure 1
Figure 1
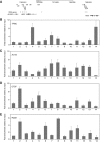
Location of tDNAs suggests functional roles. (A) A schematic representation of a highly conserved genomic locus spanning ∼140 kb on chromosome 17. Gene diagrams illustrate the positions of the nine RNA pol II transcribed genes in this region. The position of tDNAs is depicted as tick marks. Synteny of the tDNAs within this locus is shown as a further tick mark in the row of the species in which it is syntenic. (B) Box and whisker plots depicting the distance between binding sites and the end points of histone H3 lysine 27 trimethylated domains in K562 cells.
Figure 2
Figure 2
Identification of chromatin domains in K562 cells. (A) ENCODE ChIP-seq data for the distribution of TFIIIC, histone H3K27me3, H3K4me3 and H3K36me3 are plotted across the chromosome 17 domain. The position of tDNAs and RNA pol II transcribed genes is shown. (B) Transcription status of genes at the chromosome 17 locus. Quantitative RT–PCR analyses of RNA isolated from K562 cells. RNA was measured from three independent biological replicates and error bars represent standard deviation. Schematic representation showing the locations of genes is present above the graph.
Figure 3
Figure 3
Distribution of proteins on chromosome 17. (A) Diagram of the tDNA clusters and surrounding RNA pol II transcribed genes on chromosome 17. Numbered black bars (1–14) depict the location of PCR probes (sequences present in supplementary tables). All chromatin IP experiments were performed in K562 cells. (B) Quantitative chromatin immunoprecipitations using antibodies against a TFIIIC subunit (GTF3C5) were performed to determine the distribution of these proteins across a region of chromosome 17. (C) Acetylated histone H3 distribution across a region of chromosome 17. (D) CTCF was mapped across this region by quantitative chromatin immunoprecipitation. (E) The protein Rad21 distribution was mapped across the tDNA cluster on chromosome 17 using quantitative ChIP and antibodies against Rad21. All qChIP experiments are the average of at least two independent crosslinkings, with two immunoprecipitations from each crosslinking. Error bars represent standard error.
Figure 4
Figure 4
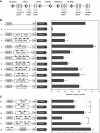
Human tDNAs possess enhancer-blocking activity. (A) Schematic representation of the chromosome 17 locus analysed in the enhancer-blocking assay with the tDNA clusters shown as bars. (B) Enhancer-blocking constructs containing murine HS2 enhancer of the β-globin gene and the human γ-globin promoter drive expression of a neomycin-resistant gene. A positive control for insulator activity contains two copies of the cHS4 insulator. Constructs lacking the enhancer or lacking an insulator fragment were used as controls for expression of the neomycin resistance gene. tDNA-containing fragments from chromosomes 6, 17 and 19 were cloned between the enhancer and the promoter. The arrowheads indicate the number of tDNAs present in each test fragment. K562 cells were transfected and the number of neomycin-resistant colonies growing in soft agar were quantified. The data are the average of three transfection experiments and error bars are standard error. (C) Analysis of enhancer-blocking ability of the first two clustered tDNAs from upstream of the ALOXE3 gene. Arrowheads indicate the number and orientation of the DNA fragments (asterisks denote P<0.02).
Figure 5
Figure 5
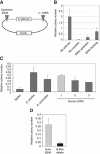
Human tDNAs function as barrier insulators in S. pombe. (A) Schematic depiction of the plasmid construct used to test for barrier insulation in S. pombe. (B) Equal amounts of various plasmids containing S. pombe tDNAs were used along with a Leu1+ plasmid to transform an S. pombe strain. Transformants were plated on minimal media plates lacking either uracil or leucine and the number of colonies able to grow on media lacking uracil or leucine were counted. Data shown is the average with standard error of three independent transformation experiments. (C) Human tDNA pairs from the ALOXE3 and PER1 cluster (horizontal bars) on chromosome 17 were cloned into the plasmid shown in (A). Insulator activity of recombinant plasmids containing human tDNAs was determined as described for (B). Data shown is the average with standard error of three independent transformation experiments. Colony number was normalized to the number of colonies in a construct lacking a silencer. (D) A 3 bp mutation in the human tDNAs in the strongest fragment (hatched column in C) was mutated and the insulator assay was repeated as described.
Figure 6
Figure 6
Human tDNAs can block repression. Tethering of a repressor protein can silence genes. ALOXE3 tDNA pair1 or a cHS4 insulator-containing fragment were cloned between 9 × Gal4 binding sites and the luciferase gene and integrated into an FRT site in HEK-293 cells. Gal4–CBX4 or Gal4 DBD alone was transfected along with a GFP expressing plasmid and GFP+ cells were first sorted and then replated. Expression of the luciferase gene was measured 24 h later. The graph depicts percent expression by comparing Gal4–DBD transfected lines with GBD-CBX4 lines from three experiments. Asterisk denotes P<0.05.
Figure 7
Figure 7
tDNAs can protect a randomly integrated transgene from silencing. (A) Schematic representation of the constructs used in the transgene protection assay. (B) A box plot of the percent of GFP expressing cells is plotted as a function of number of days. A single copy of chicken HS4 is compared with a single copy of the ALOXE3 tDNA pair1 insulator and an uninsulated transgene. The box includes the 25th–75th percent quartiles, the line is the median and the whiskers are 1.5 × the interquartile range. Open circles denote data points that are outside the whiskers (n=13 cell lines for no insulator; 15 cell lines for chicken HS4, 13 cell lines for tDNA and 15 cell lines for B-box delete).
Figure 8
Figure 8
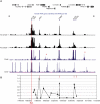
tDNAs coalesce together in human cells. (A) 4C-Seq analysis of the ALOXE3 tDNA cluster with associated loci on the human chromosome 17. A schematic representation of the RNA pol II and pol III transcribed genes around the bait fragment is shown. 4C reads are shown for the two biological replicates (sample 1 and sample 2). The bait fragment is marked by a red line. Asterisks mark ETC sites. (B) Quantitative 3C analysis of the ALOXE3 DNA fragment and its interactions with other Pst1 fragments across a 150-kb region in K562 cells. Relative interactions are plotted in arbitrary units. tDNA-containing fragments are marked by red bars at the top of the figure. Error bars are standard error of three reactions.

Similar articles

Cited by

References

    1. Adams C, Haldar D, Kamakaka RT (2005) Construction and characterization of a series of vectors for Schizosaccharomyces pombe. Yeast 22: 1307–1314 - PubMed
    1. Bachman N, Gelbart ME, Tsukiyama T, Boeke JD (2005) TFIIIB subunit Bdp1p is required for periodic integration of the Ty1 retrotransposon and targeting of Isw2p to S. cerevisiae tDNAs. Genes Dev 19: 955–964 - PMC - PubMed
    1. Barski A, Chepelev I, Liko D, Cuddapah S, Fleming AB, Birch J, Cui K, White RJ, Zhao K (2010) Pol II and its associated epigenetic marks co-localize throughout the genome with pol III-transcribed non-coding RNA genes. Nat Struct Mol Biol 17: 629–634 - PMC - PubMed
    1. Barski A, Cuddapah S, Cui K, Roh TY, Schones DE, Wang Z, Wei G, Chepelev I, Zhao K (2007) High-resolution profiling of histone methylations in the human genome. Cell 129: 823–837 - PubMed
    1. Bartlett J, Blagojevic J, Carter D, Eskiw C, Fromaget M, Job C, Shamsher M, Trindade IF, Xu M, Cook PR (2006) Specialized transcription factories. Biochem Soc Symp 73: 67–75 - PubMed

Publication types

MeSH terms

Associated data