. 2011 Nov 21;208(12):2545-60.
doi: 10.1084/jem.20110853. Epub 2011 Nov 14.

IGSF4 is a novel TCR ζ-chain-interacting protein that enhances TCR-mediated signaling

Affiliations

IGSF4 is a novel TCR ζ-chain-interacting protein that enhances TCR-mediated signaling

Hye-Ran Kim et al. J Exp Med. .

Abstract

Immunoglobulin superfamily member 4 (IGSF4) is a known ligand of CRTAM, a receptor expressed in activated NKT and CD8(+) T cells, but its function in T cell immunity has not been elucidated. In this study, we show that IGSF4 directly interacts with the T cell receptor (TCR) ζ-chain and enhances TCR signaling by enhancing ζ-chain phosphorylation. Ectopic overexpression of IGSF4 enhances TCR-mediated T cell activation. In contrast, IGSF4 knockdown shows a dramatic decrease in markers associated with T cell activation compared with those in control small interfering RNA. The transmembrane domain is essential for TCR ζ-chain association and clustering to the immunological synapse, and the ectodomain is associated with T cell interaction with antigen-presenting cells (APCs). IGSF4-deficient mice have impaired TCR-mediated thymocyte selection and maturation. Furthermore, these mice reveal attenuated effector T cell functions accompanied by defective TCR signaling. Collectively, the results indicate that IGSF4 plays a central role in T cell functioning by dual independent mechanisms, control of TCR signaling and control of T cell-APC interaction.


Figures
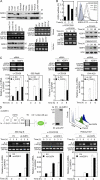
Figure 1.
Figure 1.
IGSF4 is expressed in human and mouse T cells and positively regulates T cell responses. (A) Western blot and RT-PCR analyses. (top) Tissue distribution of IGSF4 in 8-wk-old mice. IGSF4 expression in T cell lines (bottom left) and purified mouse or human T cell subsets (bottom right). #, clone number; SP, splenic CD3+ T cells. (B) Jurkat T cells (top), human PBLs (bottom left), and mouse splenic CD3+ T cells (bottom right) were stimulated for the indicated times with anti-CD3/28, and the expression of IGSF4 or IL-2 was assessed by quantitative PCR and flow cytometric analyses (top), RT-PCR analysis (bottom left), and Western blot analysis (bottom right). (A and B) The data are representative of three independent experiments. (C) Jurkat T cells (left) and human PBLs (middle) were transfected with either 70 µM of scrambled (SC) siRNA or siRNA targeting IGSF4. IGSF4 expression was measured after 48 h of transfection (top). Stimulation of cells and IL-2 mRNA measurements were performed as described in B. The results are the mean ± SD of triplicate experiments. (right) Purified splenic CD3+ T cells from TCR transgenic DO11.10 mice were transfected with 1 µg/100 µl shRNA targeting IGSF4. The IGSF4 knockdown efficiency was analyzed after 48 h of transfection (top). The cells were coincubated with 50 ng/ml OVA–pulsed A20 mouse B cells, and the IL-2 mRNA levels were measured. The results are the mean ± SD of triplicate experiments. (D, top) Establishment of Jurkat T cells overexpressing GFP or WT-IGSF4_GFP by lentiviral transduction. The efficiency of viral infection was determined by Western blot and flow cytometric analyses. IB, immunoblot. (bottom) The cells were then stimulated with SEE-pulsed Raji B cells, anti-CD3/28, or PMA/A23187 for the indicated time. IL-2 mRNA levels were assessed by RT-PCR (blots) and real-time quantitative PCR (graphs) analyses. The results are the mean ± SD of triplicate experiments. Molecular mass (M) is indicated in kilodaltons. EV, empty vector.
Figure 2.
Figure 2.
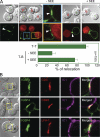
IGSF4 localizes at the c-SMAC in the immunological synapse. (A) J-IGSF4_GFP cells were incubated with Raji B cells stained with orange CMRA in the presence or absence of SEE. Arrowheads indicate the polarized IGSF4 (green) at the cell–cell contact sites. The percentage of T–T or T–B conjugates with surface IGSF4 relocation at the contact zone relative to the total number of conjugates in the absence or presence of SEE was analyzed from a total of 150 conjugates of each category. The results are the mean ± SD of triplicate experiments. The boxed areas (blue and orange) are represented as zoomed images in the right panels. (B) J-IGSF4_GFP cells were stained with anti-CD3 (cy5), anti-CD45 (cy5), or anti–LFA-1 (cy5) Fabs and then incubated with SEE-loaded Raji B cells stained with anti–ICAM-1 (cy3) Fab. See also Video 1. The data are representative of four independent experiments. The panels on the right represent zoomed images of the boxed areas (yellow) indicated in the differential interference contrast images. Bars, 10 µm.
Figure 3.
Figure 3.
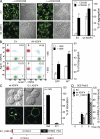
IGSF4 enhances T cell–T cell and T cell–APC adhesions by ectodomain interaction. (A) J-GFP or J-IGSF4_GFP cells (2 × 10⁵ cells/well) were cultured in the presence or absence of anti-CD3/28 for 3 h and photographed. Quantitation of cell aggregation was determined as described in Materials and methods. The results are the mean ± SD of six experiments. *, P < 0.05 versus J-GFP cells without stimulation. **, P < 0.05 versus J-GFP cells with anti-CD3/28 stimulation. DIC, differential interference contrast; EV, empty vector. (B) A representative conjugate formation profile with T cells and Raji B cells and the percentage of DP cells (blue) are shown in the flow cytometric plot and bar graph, respectively. The results are the mean ± SD of triplicate experiments. *, P < 0.05 versus J-GFP cells without stimulation. **, P < 0.05 versus J-GFP cells with SEE-pulsed Raji B cells. (C and D) Domain swapping from the IGSF4 ectodomain to ICAM-1 D3–5 in IGSF4-mediated T cell activation. (C, top) Arrows indicate the relocation of IGSF4 at the cell–cell contact regions in Jurkat T cells expressing WT-IGSF4_GFP but not IC1_IGSF4_GFP. (bottom) Schematic illustration showing swapped region of IGSF4/EXTD with ICAM1/D3-5. Quantitation of IGSF4 or IC1_IGSF4 relocation was performed as described in Fig. 2 A. The results are the mean ± SD of four experiments. IG4, IGSF4; IC1, ICAM-1 D3–5. (D) These cells were stimulated with SEE-pulsed Raji B cells, and the IL-2 mRNA levels were assessed by real-time quantitative PCR. The results are the mean ± SD of triplicate experiments. *, P < 0.05, as compared with cells expressing WT-IGSF4. Bars: (A) 100 µm; (C) 10 µm.
Figure 4.
Figure 4.
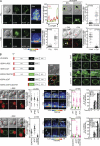
IGSF4 recruitment to the immunological synapse is independent off receptor–ligand interaction but is mediated by the TM domain. (A, left) J-IGSF4_GFP cells were placed on chambered coverslips coated with PLL or anti-CD3. Confocal images were obtained and reconstituted to the three-dimensional images by the FLUOVIEW program. The fluorescent intensity caused by the accumulation at the PLL or anti-CD3–coated surface was quantified. Note, a = contact region and b = opposite region. Each dot represents a single measurement, and at least 50 cells were examined. The data are representative of two independent experiments. (right) J-IGSF4_GFP cells were incubated with either BSA or anti-CD3/28–coated beads (top) or SEE-pulsed Raji B cells in the presence or absence of 1 µg/ml colchicine (Col) for 30 min (bottom), and live-cell imaging was performed. Arrowheads indicate IGSF4 accumulation at the synapse sites. Boxed areas (green) are shown as magnified images in the micrographs below. The fluorescent intensity caused by the accumulation at the T cell–APC contact site was quantified. Data analysis was performed as described in A (left). The data are representative of two independent experiments. DIC, differential interference contrast. (B, top left) Schematic diagram showing deletion and swapping mutants of IGSF4 (top). T cell–B cell conjugates were stained with anti-CD43 (FITC) and anti-CD3 (cy3). The arrowhead reveals the exclusion of CD43 from the immunological synapse (bottom). (top right) Localization pattern of each mutant of IGSF4 in HEK293T and Jurkat T cells. (bottom left and middle) Jurkat T cells expressing IGSF4_GFP or mutants (IGSF4ΔPDZ, IGSF4ΔCT, IGSF4/CD43TM, IGSF4/ΔEXT, or IGSF4/ΔEXT/CD43TM) were either incubated with SEE-loaded Raji B cells (bottom left) or placed on coverslips coated with PLL or anti-CD3 (bottom middle), and confocal analysis was performed. At least 20 z-stack images were reconstituted into a three-dimensional image for the bottom middle panel. Intensity represents accumulation from low (blue) to high (red). Quantitation and data analysis were performed as described in A (left). The data are representative of four independent experiments. (bottom right) Real-time quantitative PCR analysis of IL-2 mRNA expression in response to anti-CD3/28. *, P < 0.05; and +, P < 0.01, as compared with cells expressing WT-IGSF4. The results are the mean ± SD of triplicate experiments. EV, empty vector. (A and B) Horizontal bars indicate the mean. Bars, 10 µm.
Figure 5.
Figure 5.
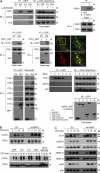
IGSF4 associates with the TCR ζ-chain through the TM domain and boosts TCR-mediated signal transduction. (A, top) J-GFP or J-IGSF4_GFP cells were incubated for 30 min with or without anti-CD3/28. Cell lysates were immunoprecipitated with anti-GFP (top left) or anti–TCR ζ-chain (top right) and then immunoblotted with antibodies against the indicated molecules (ζ-chain, Lck, Zap70, or IGSF4). (middle) HEK293T cells were cotransfected with WT-IGSF4_GFP and TCR ζ_RFP, and then immunoprecipitation (IP) and immunoblotting (IB) were performed as in the top left blots. Confocal images show surface localization of IGSF4_GFP and TCR ζ_RFP. The boxed area (yellow) is represented as zoomed images in the right and bottom micrographs. Bar, 10 µm. (bottom left) J-GFP or J-IGSF4_GFP cell pellets were lysed, immunoprecipitated with anti-GFP, and then immunoblotted with antibodies against the indicated molecules (TCR α and β, CD3γ, CD3δ, CD3ε, TCR ζ, and GFP). Total lysates were also immunoblotted with the same antibodies indicated above. The data are representative of two independent experiments. (bottom right) Immunoprecipitation and immunoblotting of Jurkat T cells expressing GFP, WT-IGSF4_GFP, or the indicated mutants (ΔCT, ΔEXT, CD43TM, and ΔEXT/CD43TM) as in A (top left). The data are representative of at least three independent experiments. EV, empty vector; IG4, IGSF4. (B) Jurkat T cells expressing GFP, WT-IGSF4_GFP, or mutant IGSF4 (ΔCT, ΔEXT, and ΔEXT/CD43TM) were stimulated with plate-bound anti-CD3 for the indicated time. The cells lysates were immunoblotted by using antibodies against phosphorylated (p) and total (t) ζ-chain. The data are representative of three independent experiments. (C) J-GFP or J-IGSF4_GFP cells were stimulated with plate-bound anti-CD3 for the indicated time. The cell lysates were immunoblotted for the phosphorylated and total forms of Lck, Zap70, ERK, and p38 kinase. The data are representative of at least three independent experiments. Molecular mass (M) is indicated in kilodaltons.
Figure 6.
Figure 6.
Generation of IGSF4-deficient mice and characterization of phenotype. (A) The trap vector, pU-21W, was inserted into the first intron of IGSF4. P1-2 (a primer set for the trap vector insertion point in the first intron; red arrows) and T1-2 (a primer set for the trap vector–specific sequence; orange arrows) were used for genotyping, and E1-2 (a primer set for the exon 1– and exon 2–specific sequence; blue arrows) was used for RT-PCR to detect endogenous IGSF4 mRNA. (B) PCR genotyping. Genomic DNA was extracted from mouse ear tissue. The WT (+/+) and trap (GT) alleles were detected with P1-2, but the homozygote (GT/GT) allele was not detected with this primer set (top). Total RNA was also extracted from mouse ear tissue, and the levels of IGSF4 mRNA were determined by using E1-2 (bottom). (C) Phenotypic comparison of IGSF4+/+ and IGSF4GT/GT mice. 4-wk-old and E18.5 WT and knockout littermates of size differences are shown. The organs from the IGSF4GT/GT mice are slightly smaller than those of the WT littermates (He, heart; Ki, kidney; Sp, spleen; Th, thymus). Body weight was measured weekly. The data represent the mean ± SD (n = 8).
Figure 7.
Figure 7.
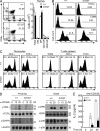
IGSF4GT/GT mice show substantial blockade of intrathymic T cell development. (A) Thymocytes were stained with FITC-conjugated anti-CD4 and Cy5.5-conjugated anti-CD8 mAbs, and then the cells were analyzed by flow cytometry. On dot plots, the percentage of cells in each quadrant is indicated. Mean cell numbers of thymocyte subsets are shown in the bar graph (right). The results are the mean ± SD of triplicate experiments. *, P < 0.05, as compared with cells from IGSF4+/+ mice. (B) Flow cytometric analysis of TCR-β, CD5, and CD69 in IGSF4+/+ and IGSF4GT/GT thymocytes. Numbers above bracketed lines indicate the percentage of TCR-βhi, CD69hi, and CD5hi cells. (C) Surface expression of CD3ε, TCR ζ-chain, and TCR-β on thymocytes or lymphocytes from IGSF4+/+ and IGSF4GT/GT. (A–C) Data are representative of at least five to six independent experiments. (D) Thymocytes from IGSF4+/+ and IGSF4GT/GT mice were stimulated with anti-CD3/28 for the indicated time. The phosphorylated (p) and total (t) forms of Lck, Zap70, ERK, and p38 kinase were determined by Western blot analysis. Data are representative of two independent experiments. Molecular mass (M) is indicated in kilodaltons. (E) Thymocytes were stimulated with anti-CD3/28 for the indicated time, and the cytokine productions (IL-2) were measured by ELISA. The results are the mean ± SD of triplicate experiments. *, P < 0.05, as compared with cells from IGSF4+/+ mice.
Figure 8.
Figure 8.
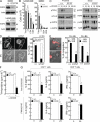
IGSF4GT/GT mice show defective T cell function. (A) IGSF4 expression in purified CD3+ T cells from the spleens and lymph nodes of WT and IGSF4GT/GT mice. Molecular mass (M) is indicated in kilodaltons. (B) The number of each cell type in the lymph node and spleen. The results are the mean ± SD of triplicate experiments. *, P < 0.05, as compared with IGSF4+/+ mice. (C) T cells purified from the spleen were stimulated with anti-CD3/28 for the indicated time. The phosphorylated (p) and total (t) forms of Lck, Zap70, ERK, and p38 kinase were determined by Western blot analysis. Data are representative of three independent experiments. (D) Allogeneic DCs and CD3+ T cells from WT or IGSF4GT/GT mice were incubated in SEB-containing medium for 3 h to allow conjugation. The cells were fixed and stained with anti–p-tyrosine (4G10; arrows). Polarization of p-tyrosine in T cells was quantified by cell counting (n > 50). Data are representative of at least three independent experiments. DIC, differential interference contrast. (E) CD3+ T cells were mixed with SEB-pulsed CD11C+ DCs (red) or CD19+ B cells from WT mice, and then conjugate formation was determined by confocal microscopy (left) and flow cytometry (bar graphs). (F) Purified splenic CD3+ T cells from WT and IGSF4GT/GT mice were incubated with anti-CD3/28 for 72 h. Cell proliferation was assessed by [3H]thymidine incorporation. (G) CD4+ or CD8+ T cells were stimulated with anti-CD3/28 or PMA/A23187 for 24 h, and the cytokine productions (IL-2, IL-4, and IFN-γ) were measured by ELISA. (E–G) The results are the mean ± SD of triplicate experiments. *, P < 0.05, as compared with cells from IGSF4+/+ mice. Bars: (D) 5 µm; (E) 10 µm.

Similar articles

Cited by

References

    1. Abbas A.R., Baldwin D., Ma Y., Ouyang W., Gurney A., Martin F., Fong S., van Lookeren Campagne M., Godowski P., Williams P.M., et al. 2005. Immune response in silico (IRIS): immune-specific genes identified from a compendium of microarray expression data. Genes Immun. 6:319–331 10.1038/sj.gene.6364173 - DOI - PubMed
    1. Arase N., Takeuchi A., Unno M., Hirano S., Yokosuka T., Arase H., Saito T. 2005. Heterotypic interaction of CRTAM with Necl2 induces cell adhesion on activated NK cells and CD8+ T cells. Int. Immunol. 17:1227–1237 10.1093/intimm/dxh299 - DOI - PubMed
    1. Azzam H.S., Grinberg A., Lui K., Shen H., Shores E.W., Love P.E. 1998. CD5 expression is developmentally regulated by T cell receptor (TCR) signals and TCR avidity. J. Exp. Med. 188:2301–2311 10.1084/jem.188.12.2301 - DOI - PMC - PubMed
    1. Beyers A.D., Spruyt L.L., Williams A.F. 1992. Molecular associations between the T-lymphocyte antigen receptor complex and the surface antigens CD2, CD4, or CD8 and CD5. Proc. Natl. Acad. Sci. USA. 89:2945–2949 10.1073/pnas.89.7.2945 - DOI - PMC - PubMed
    1. Biederer T., Sara Y., Mozhayeva M., Atasoy D., Liu X., Kavalali E.T., Südhof T.C. 2002. SynCAM, a synaptic adhesion molecule that drives synapse assembly. Science. 297:1525–1531 10.1126/science.1072356 - DOI - PubMed

Publication types

MeSH terms