

Discovering transcription factor regulatory targets using gene expression and binding data
- PMID: 22084256
- PMCID: PMC3259433
- DOI: 10.1093/bioinformatics/btr628
Discovering transcription factor regulatory targets using gene expression and binding data
Abstract
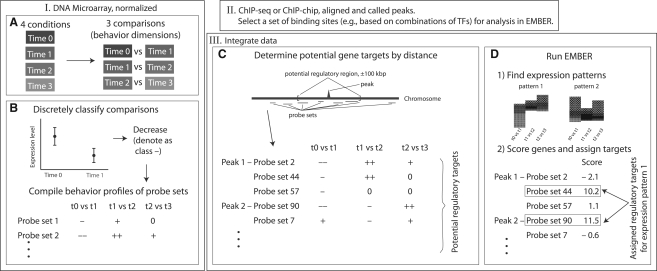
Motivation: Identifying the target genes regulated by transcription factors (TFs) is the most basic step in understanding gene regulation. Recent advances in high-throughput sequencing technology, together with chromatin immunoprecipitation (ChIP), enable mapping TF binding sites genome wide, but it is not possible to infer function from binding alone. This is especially true in mammalian systems, where regulation often occurs through long-range enhancers in gene-rich neighborhoods, rather than proximal promoters, preventing straightforward assignment of a binding site to a target gene.
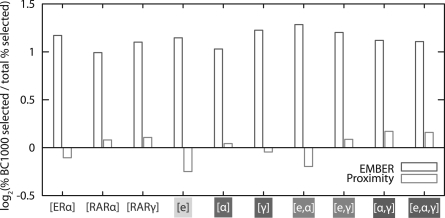
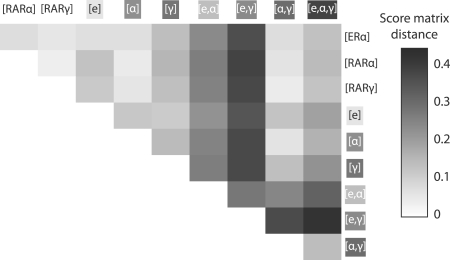
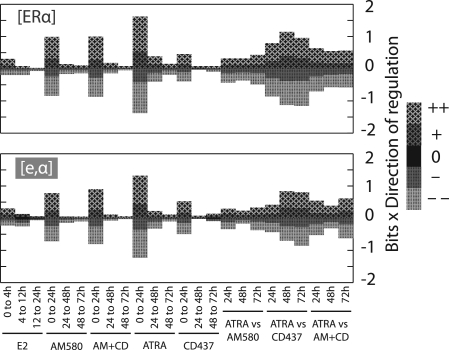
Results: We present EMBER (Expectation Maximization of Binding and Expression pRofiles), a method that integrates high-throughput binding data (e.g. ChIP-chip or ChIP-seq) with gene expression data (e.g. DNA microarray) via an unsupervised machine learning algorithm for inferring the gene targets of sets of TF binding sites. Genes selected are those that match overrepresented expression patterns, which can be used to provide information about multiple TF regulatory modes. We apply the method to genome-wide human breast cancer data and demonstrate that EMBER confirms a role for the TFs estrogen receptor alpha, retinoic acid receptors alpha and gamma in breast cancer development, whereas the conventional approach of assigning regulatory targets based on proximity does not. Additionally, we compare several predicted target genes from EMBER to interactions inferred previously, examine combinatorial effects of TFs on gene regulation and illustrate the ability of EMBER to discover multiple modes of regulation.
Availability: All code used for this work is available at http://dinner-group.uchicago.edu/downloads.html.
Figures
Similar articles
-
De novo prediction of cis-regulatory elements and modules through integrative analysis of a large number of ChIP datasets.BMC Genomics. 2014 Dec 2;15:1047. doi: 10.1186/1471-2164-15-1047. BMC Genomics. 2014. PMID: 25442502 Free PMC article.
-
ChIP-GSM: Inferring active transcription factor modules to predict functional regulatory elements.PLoS Comput Biol. 2021 Jul 22;17(7):e1009203. doi: 10.1371/journal.pcbi.1009203. eCollection 2021 Jul. PLoS Comput Biol. 2021. PMID: 34292930 Free PMC article.
-
TIP: a probabilistic method for identifying transcription factor target genes from ChIP-seq binding profiles.Bioinformatics. 2011 Dec 1;27(23):3221-7. doi: 10.1093/bioinformatics/btr552. Epub 2011 Oct 29. Bioinformatics. 2011. PMID: 22039215 Free PMC article.
-
Role of ChIP-seq in the discovery of transcription factor binding sites, differential gene regulation mechanism, epigenetic marks and beyond.Cell Cycle. 2014;13(18):2847-52. doi: 10.4161/15384101.2014.949201. Cell Cycle. 2014. PMID: 25486472 Free PMC article. Review.
-
Inferring transcriptional interactions and regulator activities from experimental data.Mol Cells. 2007 Dec 31;24(3):307-15. Mol Cells. 2007. PMID: 18182844 Review.
Cited by
-
ChIP-Array 2: integrating multiple omics data to construct gene regulatory networks.Nucleic Acids Res. 2015 Jul 1;43(W1):W264-9. doi: 10.1093/nar/gkv398. Epub 2015 Apr 27. Nucleic Acids Res. 2015. PMID: 25916854 Free PMC article.
-
Transcriptome-wide signatures of tumor stage in kidney renal clear cell carcinoma: connecting copy number variation, methylation and transcription factor activity.Genome Med. 2014 Dec 11;6(12):117. doi: 10.1186/s13073-014-0117-z. eCollection 2014. Genome Med. 2014. PMID: 25648588 Free PMC article.
-
Transcriptional regulation of germinal center B and plasma cell fates by dynamical control of IRF4.Immunity. 2013 May 23;38(5):918-29. doi: 10.1016/j.immuni.2013.04.009. Epub 2013 May 16. Immunity. 2013. PMID: 23684984 Free PMC article.
-
Dynamics in Transcriptomics: Advancements in RNA-seq Time Course and Downstream Analysis.Comput Struct Biotechnol J. 2015 Aug 24;13:469-77. doi: 10.1016/j.csbj.2015.08.004. eCollection 2015. Comput Struct Biotechnol J. 2015. PMID: 26430493 Free PMC article. Review.
-
Demystifying the secret mission of enhancers: linking distal regulatory elements to target genes.Crit Rev Biochem Mol Biol. 2015;50(6):550-73. doi: 10.3109/10409238.2015.1087961. Epub 2015 Oct 8. Crit Rev Biochem Mol Biol. 2015. PMID: 26446758 Free PMC article. Review.
References
-
- Arnosti D., Kulkarni M. Transcriptional enhancers: intelligent enhanceosomes or flexible billboards? J. Cell Biochem. 2005;94:890–898. - PubMed
-
- Bailey T., Elkan C. Proceedings of the Second International Conference on Intelligent Systems for Molecular Biology. Menlo Park, CA: AAAI Press; 1994. Fitting a mixture model by expectation maximization to discover motifs in biopolymers; pp. 28–36. - PubMed
-
- Banerji J., et al. Expression of a β-globin gene is enhanced by remote SV40 DNA sequences. Cell. 1981;27:299–308. - PubMed
-
- Bar-Joseph Z., et al. Computational discovery of gene modules and regulatory networks. Nat. Biotechnol. 2003;21:1337–1342. - PubMed
-
- Barski A., et al. High-resolution profiling of histone methylations in the human genome. Cell. 2007;129:823–837. - PubMed
Publication types
MeSH terms
Substances
Grants and funding
LinkOut - more resources
Full Text Sources
Miscellaneous
