

The elongation rate of RNA polymerase determines the fate of transcribed nucleosomes
- PMID: 22081017
- PMCID: PMC3279329
- DOI: 10.1038/nsmb.2164
The elongation rate of RNA polymerase determines the fate of transcribed nucleosomes
Abstract
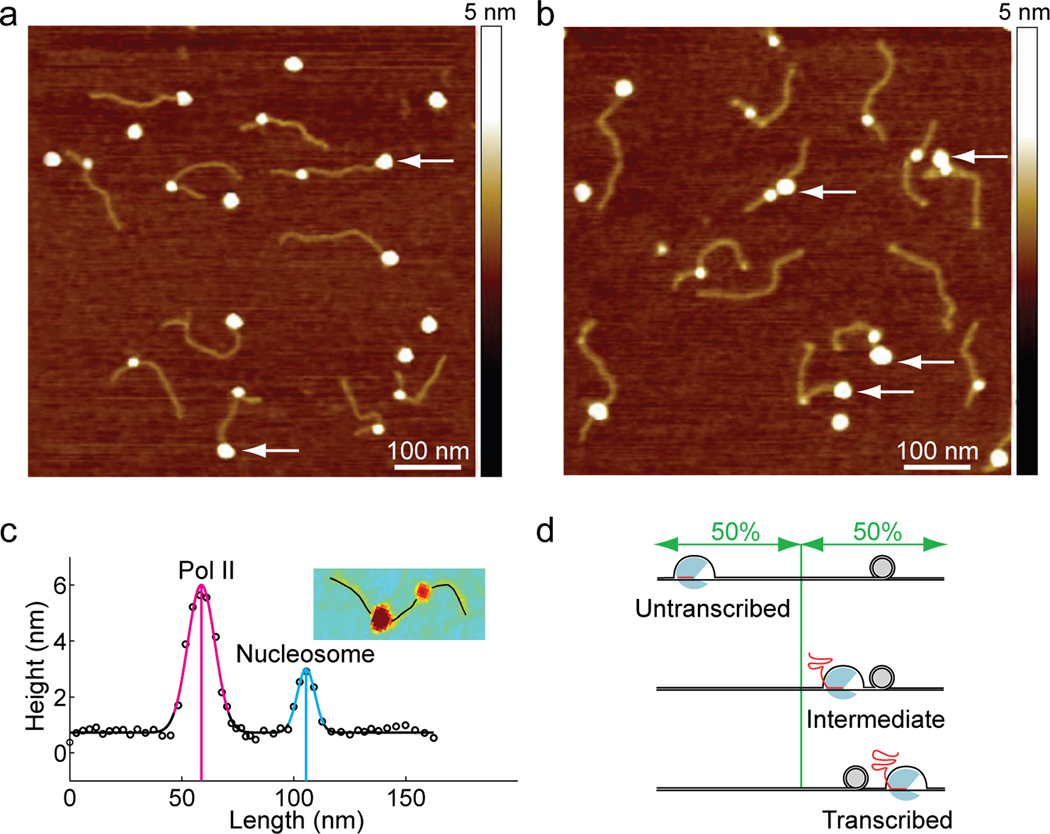
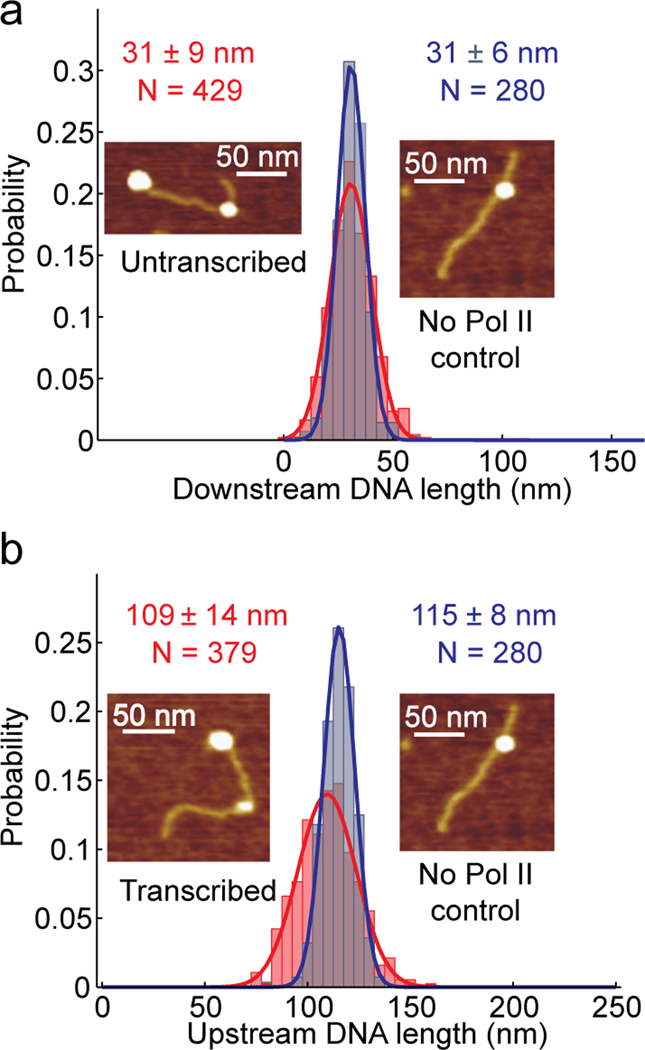
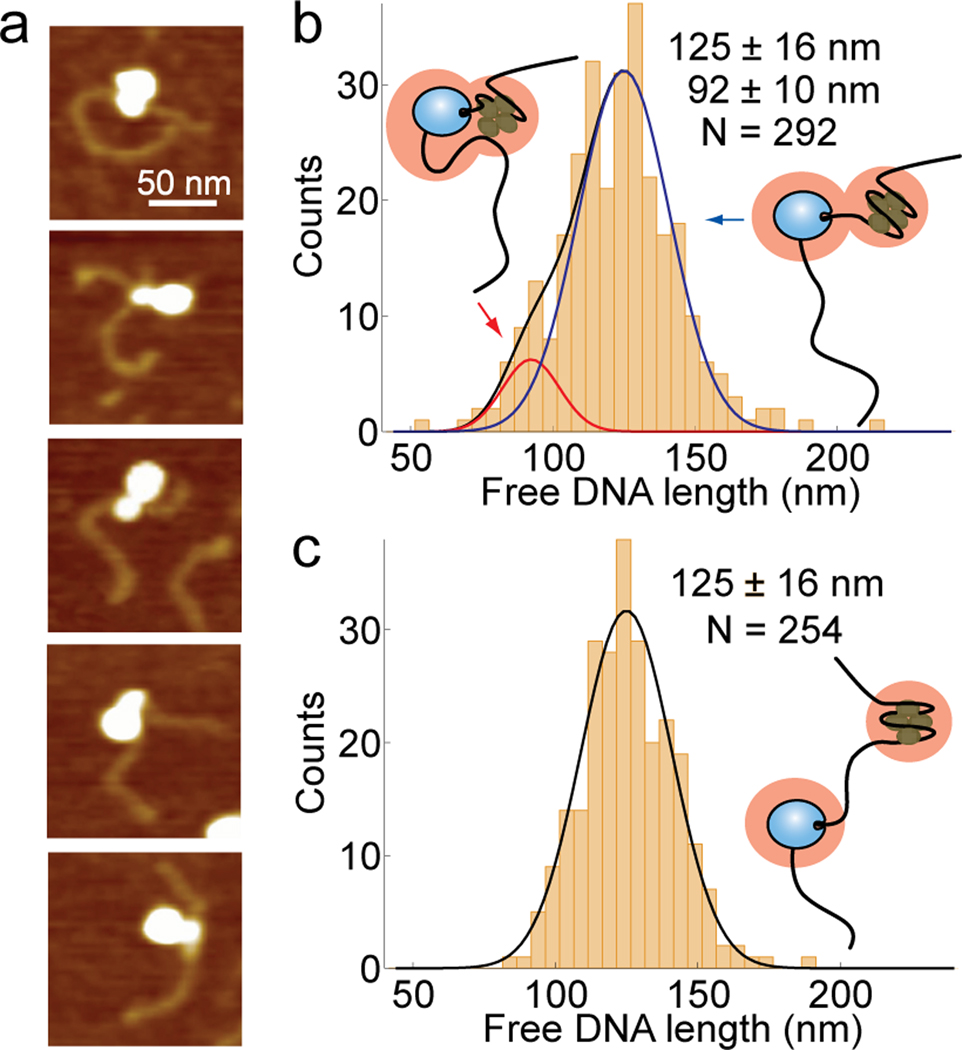
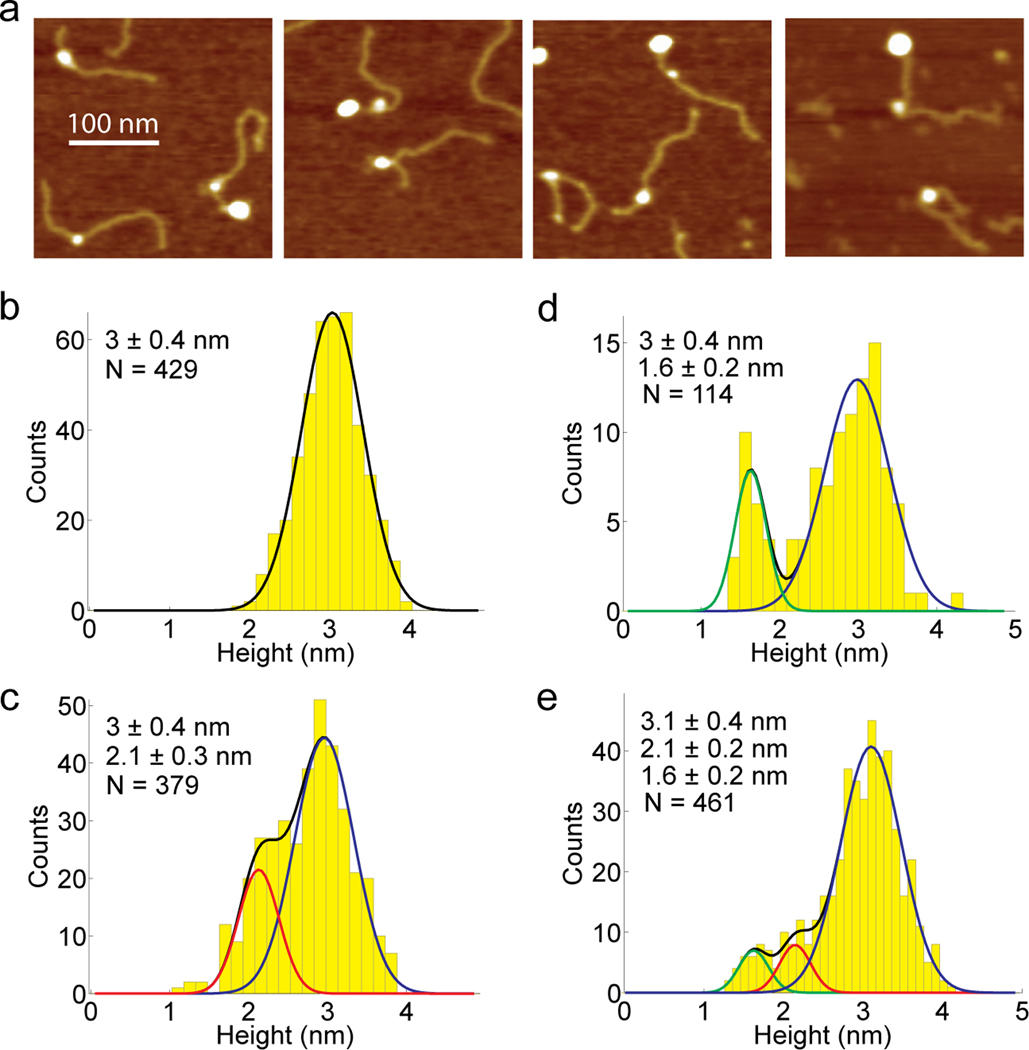
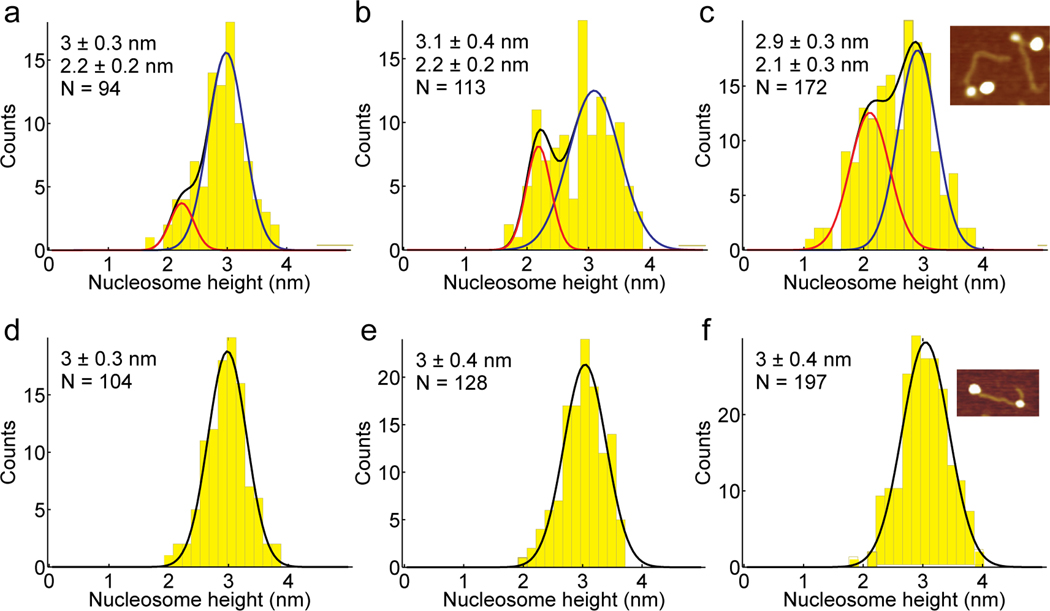
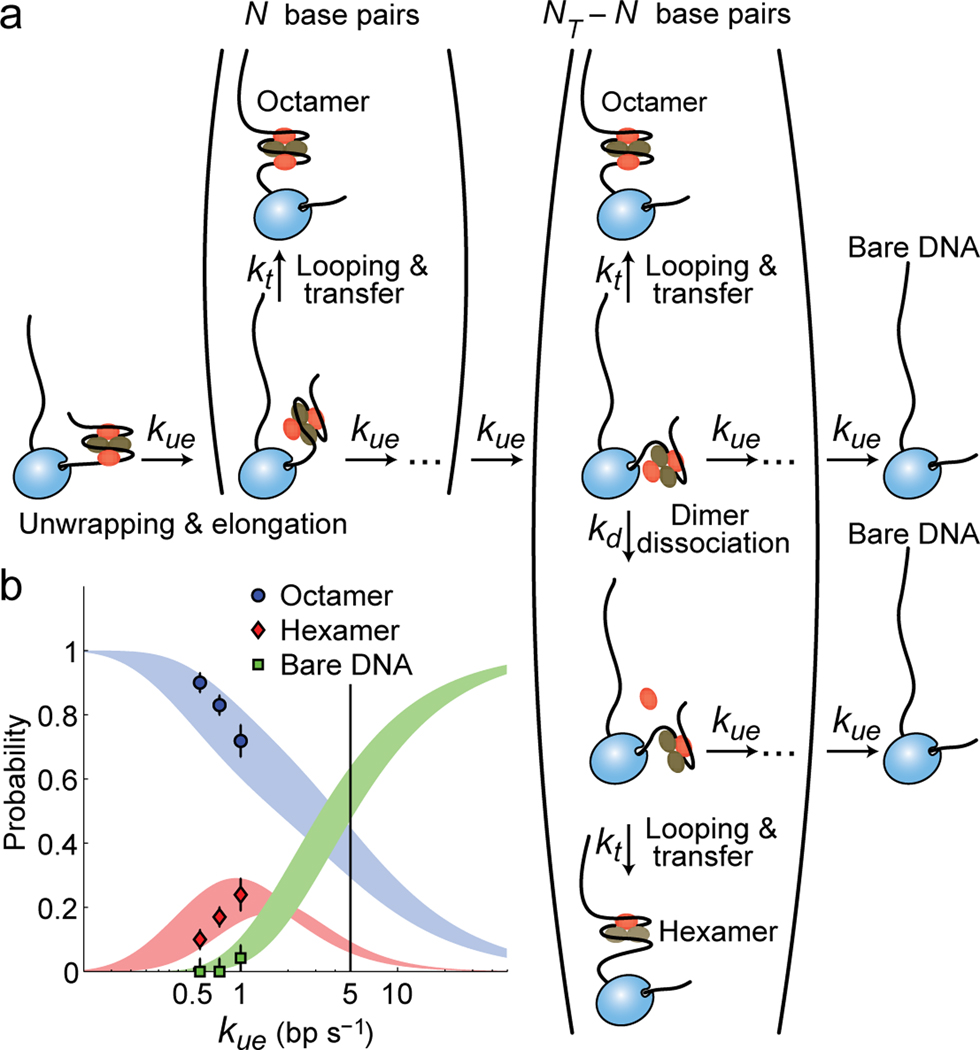
Upon transcription, histones can either detach from DNA or transfer behind the polymerase through a process believed to involve template looping. The details governing nucleosomal fate during transcription are not well understood. Our atomic force microscopy images of yeast RNA polymerase II-nucleosome complexes confirm the presence of looped transcriptional intermediates and provide mechanistic insight into the histone-transfer process through the distribution of transcribed nucleosome positions. Notably, we find that a fraction of the transcribed nucleosomes are remodeled to hexasomes, and this fraction depends on the transcription elongation rate. A simple model involving the kinetic competition between transcription elongation, histone transfer and histone-histone dissociation quantitatively explains our observations and unifies them with results obtained from other polymerases. Factors affecting the relative magnitude of these processes provide the physical basis for nucleosomal fate during transcription and, therefore, for the regulation of gene expression.
Figures
Similar articles
-
Mechanism of transcription through a nucleosome by RNA polymerase II.Biochim Biophys Acta. 2013 Jan;1829(1):76-83. doi: 10.1016/j.bbagrm.2012.08.015. Epub 2012 Sep 6. Biochim Biophys Acta. 2013. PMID: 22982194 Free PMC article. Review.
-
Analysis of the mechanism of nucleosome survival during transcription.Nucleic Acids Res. 2014 Feb;42(3):1619-27. doi: 10.1093/nar/gkt1120. Epub 2013 Nov 13. Nucleic Acids Res. 2014. PMID: 24234452 Free PMC article.
-
The elongation factor Spt4/5 regulates RNA polymerase II transcription through the nucleosome.Nucleic Acids Res. 2017 Jun 20;45(11):6362-6374. doi: 10.1093/nar/gkx220. Nucleic Acids Res. 2017. PMID: 28379497 Free PMC article.
-
Efficient and rapid nucleosome traversal by RNA polymerase II depends on a combination of transcript elongation factors.J Biol Chem. 2011 Feb 25;286(8):6040-8. doi: 10.1074/jbc.M110.174722. Epub 2010 Dec 22. J Biol Chem. 2011. PMID: 21177855 Free PMC article.
-
Changing the DNA landscape: putting a SPN on chromatin.Curr Top Microbiol Immunol. 2003;274:171-201. doi: 10.1007/978-3-642-55747-7_7. Curr Top Microbiol Immunol. 2003. PMID: 12596908 Review.
Cited by
-
Overcoming the nucleosome barrier during transcript elongation.Trends Genet. 2012 Jun;28(6):285-94. doi: 10.1016/j.tig.2012.02.005. Epub 2012 Mar 31. Trends Genet. 2012. PMID: 22465610 Free PMC article. Review.
-
Molecular traffic jams on DNA.Annu Rev Biophys. 2013;42:241-63. doi: 10.1146/annurev-biophys-083012-130304. Epub 2013 Feb 28. Annu Rev Biophys. 2013. PMID: 23451891 Free PMC article. Review.
-
Real-Time Multistep Asymmetrical Disassembly of Nucleosomes and Chromatosomes Visualized by High-Speed Atomic Force Microscopy.ACS Cent Sci. 2023 Dec 22;10(1):122-137. doi: 10.1021/acscentsci.3c00735. eCollection 2024 Jan 24. ACS Cent Sci. 2023. PMID: 38292612 Free PMC article.
-
Co-transcriptional regulation of alternative pre-mRNA splicing.Biochim Biophys Acta. 2012 Jul;1819(7):673-83. doi: 10.1016/j.bbagrm.2012.01.014. Epub 2012 Feb 2. Biochim Biophys Acta. 2012. PMID: 22326677 Free PMC article. Review.
-
Human exonization through differential nucleosome occupancy.Proc Natl Acad Sci U S A. 2018 Aug 28;115(35):8817-8822. doi: 10.1073/pnas.1802561115. Epub 2018 Aug 13. Proc Natl Acad Sci U S A. 2018. PMID: 30104384 Free PMC article.
References
-
- Thiriet C, Hayes J. Histone dynamics during transcription: exchange of H2A–H2B dimers and H3/H4 tetramers during pol II elongation. Chromatin Dynamics in Cellular Function. 2006;41:77–90. - PubMed
Publication types
MeSH terms
Substances
Grants and funding
LinkOut - more resources
Full Text Sources
Molecular Biology Databases
