. 2012 Jan;23(1):151-62.
doi: 10.1091/mbc.E11-05-0456. Epub 2011 Nov 9.

miR-503 represses CUG-binding protein 1 translation by recruiting CUGBP1 mRNA to processing bodies

Affiliations

miR-503 represses CUG-binding protein 1 translation by recruiting CUGBP1 mRNA to processing bodies

Yu-Hong Cui et al. Mol Biol Cell. 2012 Jan.

Abstract

microRNAs (miRNAs) and RNA-binding proteins (RBPs) jointly regulate gene expression at the posttranscriptional level and are involved in many aspects of cellular functions. The RBP CUG-binding protein 1 (CUGBP1) destabilizes and represses the translation of several target mRNAs, but the exact mechanism that regulates CUGBP1 abundance remains elusive. In this paper, we show that miR-503, computationally predicted to associate with three sites of the CUGBP1 mRNA, represses CUGBP1 expression. Overexpression of an miR-503 precursor (pre-miR-503) reduced the de novo synthesis of CUGBP1 protein, whereas inhibiting miR-503 by using an antisense RNA (antagomir) enhanced CUGBP1 biosynthesis and elevated its abundance; neither intervention changed total CUGBP1 mRNA levels. Studies using heterologous reporter constructs revealed a greater repressive effect of miR-503 through the CUGBP1 coding region sites than through the single CUGBP1 3'-untranslated region target site. CUGBP1 mRNA levels in processing bodies (P-bodies) increased in cells transfected with pre-miR-503, while silencing P-body resident proteins Ago2, RCK, or LSm4 decreased miR-503-mediated repression of CUGBP1 expression. Decreasing the levels of cellular polyamines reduced endogenous miR-503 levels and promoted CUGBP1 expression, an effect that was prevented by ectopic miR-503 overexpression. Repression of CUGBP1 by miR-503 in turn altered the expression of CUGBP1 target mRNAs and thus increased the sensitivity of intestinal epithelial cells to apoptosis. These findings identify miR-503 as both a novel regulator of CUGBP1 expression and a modulator of intestinal epithelial homoeostasis.


Figures
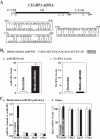
FIGURE 1:
FIGURE 1:
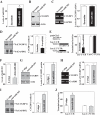
miR-503 associates with the CUGBP1 mRNA. (A) Schematic representation of CUGBP1 mRNA depicting predicted target sites for miR-503 in its CR and 3′-UTR. Alignment of the CUGBP1 mRNA sequences with miR-503: top strand, CUGBP1 mRNA; bottom strand, miR-503. (B) Levels of biotinylated miR-503 after transfection for 48 h: (a) schematic representation of biotinylated miR-503, (b) miR-503 levels as measured by Q-PCR analysis, and (c) U6 RNA levels. Values are mean ± SE from three separate experiments. * p < 0.05 compared with cells transfected with control scramble oligomer. (C) Binding of biotinylated miR-503 to mRNAs encoding CUGBP1, CDK2, JunD, and c-Myc: (a) levels of mRNAs in the materials pulled down by biotin-miR-503 and (b) levels of total input mRNAs. * p < 0.05 compared with cells transfected with scramble oligomer.
FIGURE 2:
FIGURE 2:
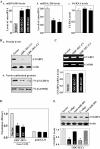
miR-503 represses CUGBP1 mRNA translation. (A) Levels of miR-503 in cells transfected with pre-miR-503 for 48 h as measured by Q-PCR analysis. Values are mean ± SE from three separate experiments. * p < 0.05 compared with cells transfected with control scramble oligomer. (B) Changes in CUGBP1 protein expression after ectopic miR-503 overexpression. Whole-cell lysates were prepared for Western blotting; equal loading was monitored by assessing β-actin levels. (C) Levels of CUGBP1 mRNA as examined by RT-PCR (left) or Q-PCR (right) analyses. (D) Changes in newly synthesized CUGBP1 protein as measured by IP with anti-CUGBP1 antibody in cells described in (A). Left, representative immunoblots of newly synthesized CUGBP1; right, quantitative analysis of the immunoblotting signals as measured by densitometry. Values are mean ± SE of data from three separate experiments; the relative levels of newly synthesized CUGBP1 were corrected by measuring GAPDH signals. * p < 0.05 compared with cells transfected with control scramble oligomer. (E) Changes in CUGBP1 translation efficiency as measured by analysis of CUGBP1-CR or its 3′-UTR luciferase reporter (schematic) after cotransfection with a Renilla luciferase reporter. Values are mean ± SE of data from three separate experiments. * p < 0.05 compared with cells transfected with control scramble oligomer. (F–J) Effect of miR-503 silencing on CUGBP1 expression. After cells were transfected with the corresponding oligomer targeting miR-503 (anti-miR-503) or C-oligo for 48 h, various measurements were performed as described above. Values are mean ± SE of data from three separate experiments. * p < 0.05 compared with cells transfected with C-oligo.
FIGURE 3:
FIGURE 3:
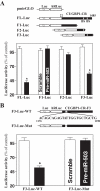
Changes in activities of CUGBP1 CR luciferase reporters after deletion of miR-503–binding site. (A) Effect of 5′-deletion of CUGBP1 CR on its luciferase reporter activity. Top, schematic of plasmids of different chimeric firefly luciferase CUGBP1 CR reporters. BS, predicted miR-503–binding site. Bottom, levels of CUGBP1 CR luciferase reporter activity. Twenty-four hours after transfection with pre-miR-503, cells were cotransfected with CUGBP1 CR F-Luc constructs and a Renilla luciferase reporter. Levels of firefly and Renilla luciferase activities were assayed 24 h later. Results were normalized to the Renilla luciferase activity and expressed as the mean ± SE of data from three separate experiments. * p < 0.05 compared with cells transfected with control scrambled oligomer. (B) Effect of deletion of specific miR-503–binding site (schematic) in CUGBP1 CR on luciferase reporter activity after ectopic miR-503 overexpression.
FIGURE 4:
FIGURE 4:
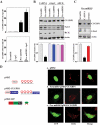
miR-503 increases CUGBP1 mRNA recruitment to P-bodies. (A) CUGBP1 mRNA interaction with components of P-bodies. After cells were transfected with the Ago2 expression vector (Ago2) or pre-miR-503 alone or cotransfected with Ago2 and pre-miR-503 for 48 h, the association of CUGBP1 mRNA with HA-Ago2 was measured by RNP IP using anti-Ago2 (top) or control IgG (bottom) antibodies, which was followed by Q-PCR analysis. Values are mean ± SE of data from three separate experiments. *,+ p < 0.05 compared with cells transfected with scramble or Ago2 and cells transfected with pre-miR-503, respectively. (B and C) Effect of silencing Ago2, RCK, and LSm4 on CUGBP1 expression in cells overexpressing miR-503. Top, representative immunoblots of CUGBP1 protein; bottom, quantitative analysis of the immunoblotting signals as measured by densitometry. Cells were transfected with pre-miR-503 or cotransfected with pre-miR-503 and specific siRNA targeting Ago2 (siAgo2), RCK (siRCK), or LSm4 (siLSm4) for 48 h; the levels of CUGBP1, Ago2, and RCK proteins (B), CUGPB1 and LSm4 proteins (C), and loading control β-actin (B and C) were assessed by Western blot analysis. Values are mean ± SE of data from three separate experiments; the relative levels of CUGBP1 were corrected for protein loading by measuring β-actin signals. * p < 0.05 compared with cells transfected with scramble or cells cotransfected with pre-miR-503 and siAgo2, siRCK or siLSm4. (D) Colocalization of CUGBP1 mRNA with P-bodies after miR-503 overexpression. Left, schematic of the plasmids used for the visualization of CUGBP1 mRNA. pMS2 and pMS2-CUGBP1 expressed MS2 and MS2-CUGBP1 RNAs, each containing 12 tandem MS2 hairpins; pMS2-YFP expressed a fusion fluorescent protein (MS2-YFP) capable of detecting MS2-containing RNA. Right, images of CUGBP1 mRNA colocalization with P-bodies in cells overexpressing miR-503. Confocal microscopy was used to visualize MS2 and MS2-CUGBP1 mRNA using MS2-YFP (green fluorescence); red, RCK (P-body marker) signals; yellow, colocalized red and green signals. Three experiments were performed that showed similar results.
FIGURE 5:
FIGURE 5:
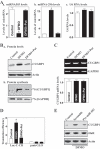
Decreasing cellular polyamines by inhibiting ODC with DFMO enhances CUGBP1 mRNA translation by reducing miR-503. (A) Changes in the levels of miR-503, miR-29b, and U6 RNA as examined by Q-PCR analysis in cells exposed to DFMO or DFMO plus putrescine (Put) for 4 d. Values are mean ± SE of data from three separate experiments. * p < 0.05 compared with control cells and cells exposed to DFMO plus putrescine. (B) Changes in the level of CUGBP1 expression after polyamine depletion: (a) representative immunoblots of CUGBP1 protein from Western blot analysis and (b) newly synthesized CUGBP1 protein as measured by IP with anti-CUGBP1 antibody. (C) Changes in CUGBP1 mRNA levels as measured by RT- (top) or Q-PCR (bottom) analysis. (D) Changes in CUGBP1 translation efficiency as measured by analysis of CUGBP1-CR luciferase reporter in cells described in (A). Values are mean ± SE of data from three separate experiments. * p < 0.05 compared with controls and cells exposed to DFMO plus Put. (E) Effect of ectopic overexpression of miR-503 on CUGBP1 expression in polyamine-deficient cells. After cells were exposed to DFMO for 2 d, they were transfected with pre-miR-503 or control scramble oligomer and then maintained in the medium containing DFMO for an additional 2 d. Levels of CUGBP1 and HuR were examined by Western blot analysis; three separate experiments were performed that showed similar results.
FIGURE 6:
FIGURE 6:
Increasing cellular polyamines by ectopic ODC overexpression represses CUGBP1 translation by increasing miR-503. (A) Changes in the levels of miR-503, miR-29b, and U6 RNA as examined by Q-PCR analysis in stable ODC-IEC cells. Values are mean ± SE of data from three separate experiments. * p < 0.05 compared with cells transfected with vector containing no ODC cDNA. (B) Changes in the level of CUGBP1 expression in stable ODC-IEC cells: (a) representative immunoblots of CUGBP1 and (b) newly synthesized CUGBP1 protein as measured by IP with anti-CUGBP1 antibody. (C) Changes in CUGBP1 mRNA levels as measured by RT- (top) or Q-PCR (bottom) analyses. (D) CUGBP1 translation efficiency as measured by analysis of CUGBP1-CR luciferase reporter in stable ODC-IEC cells. Values are mean ± SE of data from three separate experiments. * p < 0.05 compared with cells transfected with vector alone. (E) Effect of miR-503 silencing on CUGBP1 expression in stable ODC-IEC cells. Top, representative immunoblots of CUGBP1 protein; bottom, quantitative analysis of the immunoblotting signals as measured by densitometry. Cells were transfected with the corresponding oligomer targeting miR-503 (anti-miR-503) or C-oligo for 48 h; levels of CUGBP1 protein were examined by Western blot analysis. Values are mean ± SE of data from three separate experiments; the relative levels of CUGBP1 were corrected for protein loading by measuring β-actin signals. * p < 0.05 compared with vector alone or ODC-IEC cells transfected with C-oligo.
FIGURE 7:
FIGURE 7:
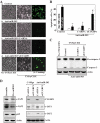
miR-503 silencing protects IEC cells against apoptosis through induction in CUGBP1. (A) TNF-α/CHX–induced apoptosis after various treatments. Cells were transfected with the anti-miR-503 or C-oligo (Control) for 48 h; apoptosis was measured 4 h after treatment with TNF-α/CHX: (a) cells transfected with C-oligo, (b) cells transfected with anti-miR-503, (c) cells transfected with anti-miR-503 and control siRNA (C-siRNA), and (d) cells transfected with anti-miR-503 and siRNA targeting CUGBP1 (siCUGBP1). Original magnification: 150×. (B) Percentages of apoptotic cells after different treatments described in (A). Values are mean ± SE of data from three experiments. * p < 0.05 compared with cells untreated with TNF-α/CHX; + p < 0.05 compared with cells exposed to TNF-α/CHX; # p < 0.05 compared with cells cotransfected with anti-miR-503 and C-siRNA and then exposed to TNF-α/CHX. (C) Changes in levels of caspase-3 in cells described in (A). Whole-cell lysates were harvested, and the levels of procaspase-3 and caspase-3 were assessed by Western blot analysis. β-actin immunoblotting was performed as an internal control for equal loading. (D) Effect of miR-503 on the expression of c-IAP and p65 proteins. Left, changes in the levels of c-IAP1, c-IAP2 and p65 proteins in cells overexpressing miR-503. Cells were transfected with pre-miR-503 for 48 h, whereupon whole-cell lysates were prepared, and the levels of various proteins were measured. Three separate experiments were performed that showed similar results. Right, the levels of CUGBP1 and c-IAP proteins after transfecting anti-miR-503 alone or transfecting both anti-miR-503 and siCUGBP1 as described in (A).

Similar articles

Cited by

References

    1. Abdelmohsen K, Srikantan S, Kuwano Y, Gorospe M. miR-519 reduces cell proliferation by lowering RNA-binding protein HuR levels. Proc Natl Acad Sci USA. 2008;105:20297–20302. - PMC - PubMed
    1. Baltimore D, Boldin MP, O'Connell RM, Rao DS, Taganov KD. MicroRNAs: new regulators of immune cell development and function. Nat Immunol. 2008;9:839–845. - PubMed
    1. Bartel DP. MicroRNAs: target recognition and regulatory functions. Cell. 2009;136:215–233. - PMC - PubMed
    1. Bhattacharyya SN, Habermacher R, Martine U, Closs EI, Filipowicz W. Relief of microRNA-mediated translational repression in human cells subjected to stress. Cell. 2006;125:1111–1124. - PubMed
    1. Buchan JR, Parker R. Eukaryotic stress granules: the ins and outs of translation. Mol Cell. 2009;36:932–941. - PMC - PubMed

Publication types

MeSH terms