Genes that confer the identity of the renin cell
- PMID: 22034642
- PMCID: PMC3279933
- DOI: 10.1681/ASN.2011040401
Genes that confer the identity of the renin cell
Erratum in
- J Am Soc Nephrol. 2012 Mar;23(3):567
Abstract
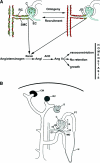
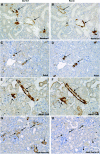
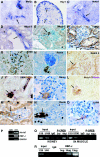
Renin-expressing cells modulate BP, fluid-electrolyte homeostasis, and kidney development, but remarkably little is known regarding the genetic regulatory network that governs the identity of these cells. Here we compared the gene expression profiles of renin cells with most cells in the kidney at various stages of development as well as after a physiologic challenge known to induce the transformation of arteriolar smooth muscle cells into renin-expressing cells. At all stages, renin cells expressed a distinct set of genes characteristic of the renin phenotype, which was vastly different from other cell types in the kidney. For example, cells programmed to exhibit the renin phenotype expressed Akr1b7, and maturing cells expressed angiogenic factors necessary for the development of the kidney vasculature and RGS (regulator of G-protein signaling) genes, suggesting a potential relationship between renin cells and pericytes. Contrary to the plasticity of arteriolar smooth muscle cells upstream from the glomerulus, which can transiently acquire the embryonic phenotype in the adult under physiologic stress, the adult juxtaglomerular cell always possessed characteristics of both smooth muscle and renin cells. Taken together, these results identify the gene expression profile of renin-expressing cells at various stages of maturity, and suggest that juxtaglomerular cells maintain properties of both smooth muscle and renin-expressing cells, likely to allow the rapid control of body fluids and BP through both contractile and endocrine functions.
Figures


Similar articles
-
Recombination signal binding protein for Ig-κJ region regulates juxtaglomerular cell phenotype by activating the myo-endocrine program and suppressing ectopic gene expression.J Am Soc Nephrol. 2015 Jan;26(1):67-80. doi: 10.1681/ASN.2013101045. Epub 2014 Jun 5. J Am Soc Nephrol. 2015. PMID: 24904090 Free PMC article.
-
Connexin expression in renin-producing cells.J Am Soc Nephrol. 2009 Mar;20(3):506-12. doi: 10.1681/ASN.2008030252. Epub 2008 Dec 10. J Am Soc Nephrol. 2009. PMID: 19073828 Free PMC article.
-
Aldo-keto reductase 1b7, a novel marker for renin cells, is regulated by cyclic AMP signaling.Am J Physiol Regul Integr Comp Physiol. 2015 Sep;309(5):R576-84. doi: 10.1152/ajpregu.00222.2015. Epub 2015 Jul 15. Am J Physiol Regul Integr Comp Physiol. 2015. PMID: 26180185 Free PMC article.
-
Plasticity of Renin Cells in the Kidney Vasculature.Curr Hypertens Rep. 2017 Feb;19(2):14. doi: 10.1007/s11906-017-0711-8. Curr Hypertens Rep. 2017. PMID: 28233238 Free PMC article. Review.
-
Renin Cells, From Vascular Development to Blood Pressure Sensing.Hypertension. 2023 Aug;80(8):1580-1589. doi: 10.1161/HYPERTENSIONAHA.123.20577. Epub 2023 Jun 14. Hypertension. 2023. PMID: 37313725 Free PMC article. Review.
Cited by
-
Building an atlas of gene expression driving kidney development: pushing the limits of resolution.Pediatr Nephrol. 2014 Apr;29(4):581-8. doi: 10.1007/s00467-013-2602-9. Epub 2013 Sep 1. Pediatr Nephrol. 2014. PMID: 23996451 Free PMC article. Review.
-
Renin Cell Development: Insights From Chromatin Accessibility and Single-Cell Transcriptomics.Circ Res. 2023 Aug 4;133(4):369-371. doi: 10.1161/CIRCRESAHA.123.322827. Epub 2023 Jul 3. Circ Res. 2023. PMID: 37395102 Free PMC article. No abstract available.
-
How does your kidney smell? Emerging roles for olfactory receptors in renal function.Pediatr Nephrol. 2016 May;31(5):715-23. doi: 10.1007/s00467-015-3181-8. Epub 2015 Aug 12. Pediatr Nephrol. 2016. PMID: 26264790 Free PMC article. Review.
-
Alternatively spliced isoforms of WT1 control podocyte-specific gene expression.Kidney Int. 2015 Aug;88(2):321-31. doi: 10.1038/ki.2015.140. Epub 2015 May 20. Kidney Int. 2015. PMID: 25993318
-
Polycystic kidneys: interaction of notch and renin.Clin Sci (Lond). 2023 Aug 14;137(15):1145-1150. doi: 10.1042/CS20230023. Clin Sci (Lond). 2023. PMID: 37553961 Free PMC article.
References
-
- Keeton TK, Campbell WB: The pharmacologic alteration of renin release. Pharmacol Rev 32: 81–227, 1980 - PubMed
-
- Gomez RA, Lynch KR, Sturgill BC, Elwood JP, Chevalier RL, Carey RM, Peach MJ: Distribution of renin mRNA and its protein in the developing kidney. Am J Physiol 257: F850–F858, 1989 - PubMed
-
- Sequeira Lopez ML, Pentz ES, Nomasa T, Smithies O, Gomez RA: Renin cells are precursors for multiple cell types that switch to the renin phenotype when homeostasis is threatened. Dev Cell 6: 719–728, 2004 - PubMed
-
- Pentz ES, Sequeira Lopez ML, Cordaillat M, Gomez RA: Identity of the renin cell is mediated by cAMP and chromatin remodeling: An in vitro model for studying cell recruitment and plasticity. Am J Physiol Heart Circ Physiol 294: H699–H707, 2008 - PubMed
Publication types
MeSH terms
Substances
Grants and funding
- K08 DK075481/DK/NIDDK NIH HHS/United States
- U01 DK070251/DK/NIDDK NIH HHS/United States
- 1R01DK085080/DK/NIDDK NIH HHS/United States
- R01 DK091330/DK/NIDDK NIH HHS/United States
- R37 HL066242/HL/NHLBI NIH HHS/United States
- UL1 TR000077/TR/NCATS NIH HHS/United States
- R37HL066242/HL/NHLBI NIH HHS/United States
- R01 HL096735/HL/NHLBI NIH HHS/United States
- K08DK75481/DK/NIDDK NIH HHS/United States
- R01HL096735/HL/NHLBI NIH HHS/United States
- 3U01DK70251/DK/NIDDK NIH HHS/United States
- R01 DK085080/DK/NIDDK NIH HHS/United States
LinkOut - more resources
Full Text Sources
Molecular Biology Databases

