Review
. 2012 Apr;69(8):1211-59.
doi: 10.1007/s00018-011-0859-3. Epub 2011 Oct 28.

Protein intrinsic disorder as a flexible armor and a weapon of HIV-1

Affiliations
Review

Protein intrinsic disorder as a flexible armor and a weapon of HIV-1

Bin Xue et al. Cell Mol Life Sci. 2012 Apr.

Abstract

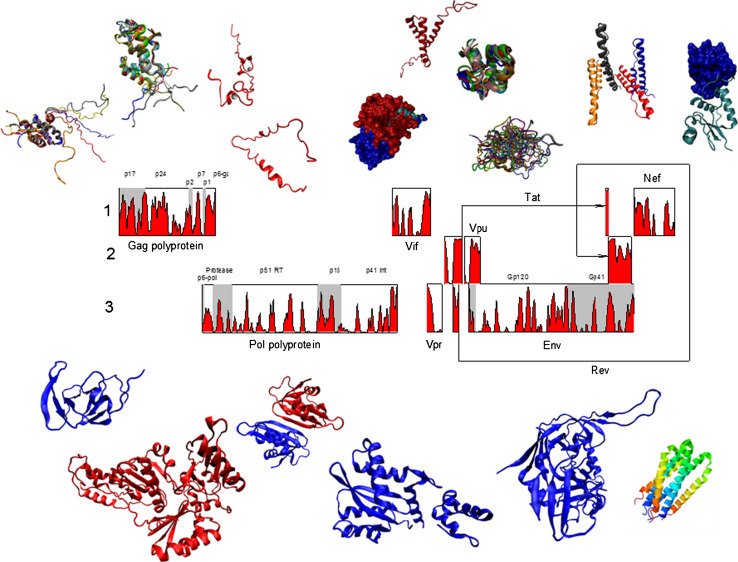
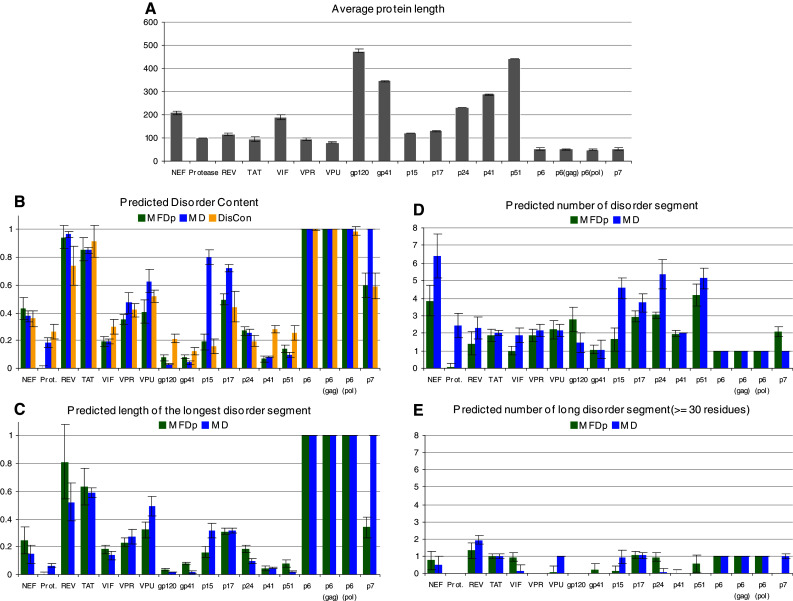
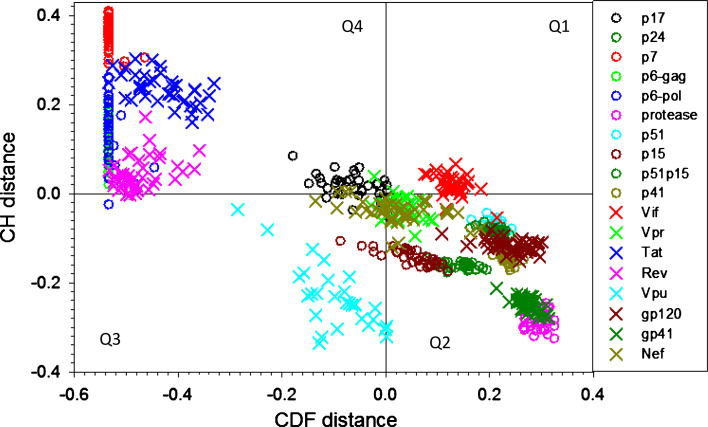
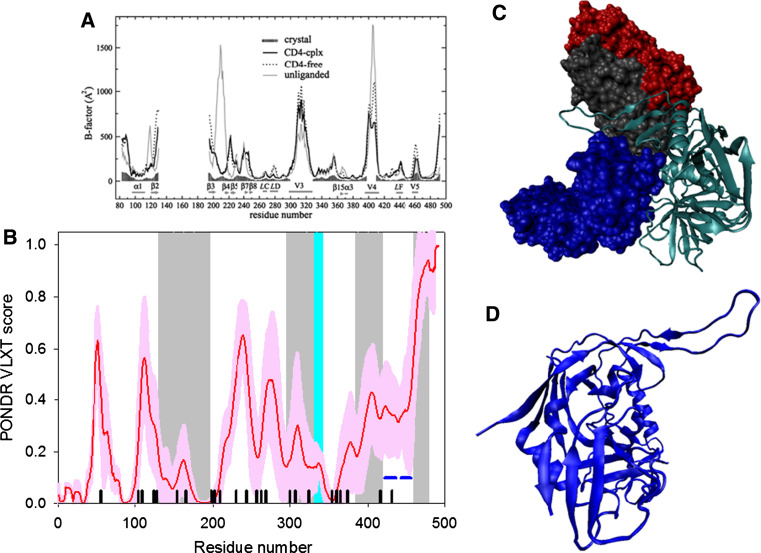
Many proteins and protein regions are disordered in their native, biologically active states. These proteins/regions are abundant in different organisms and carry out important biological functions that complement the functional repertoire of ordered proteins. Viruses, with their highly compact genomes, small proteomes, and high adaptability for fast change in their biological and physical environment utilize many of the advantages of intrinsic disorder. In fact, viral proteins are generally rich in intrinsic disorder, and intrinsically disordered regions are commonly used by viruses to invade the host organisms, to hijack various host systems, and to help viruses in accommodation to their hostile habitats and to manage their economic usage of genetic material. In this review, we focus on the structural peculiarities of HIV-1 proteins, on the abundance of intrinsic disorder in viral proteins, and on the role of intrinsic disorder in their functions.


Figures

Fig. 1
Fig. 1
The proteome map of HIV-1 and crystal or NMR structures of various HIV-proteins
Fig. 2
Fig. 2
a Length distribution of various members of the HIV-1 proteome. The error bars denote the corresponding standard deviations. b The average (across different isolates of the virus for the same protein) disorder content computed with MFDp, MD, and DisCon predictors. The error bars denote the corresponding standard deviations. c The average (across different isolates of the virus for the same protein) normalized, by the chain length, length of the longest disordered segment generated with MFDp and MD. The error bars denote the corresponding standard deviations. d The average (across different isolates of the virus for the same protein) number of the disordered segments computed with MFDp and MD predictors. We count only the segments that include at least four residues. The error bars denote the corresponding standard deviations. e The average (across different isolates of the virus for the same protein) number of long, with at least 30 residues, disordered segments computed with MFDp and MD predictors. The error bars denote the corresponding standard deviations
Fig. 3
Fig. 3
Evaluating intrinsic disorder in HIV proteins by combined binary disorder classifiers, CH plots [90] and CDFs [52]. Here, the coordinates of each point were calculated as a distance of the corresponding protein in the CH plot from the boundary (Y-coordinate) and an average distance of the respective CDF curve from the CDF boundary (X-coordinate). The four quadrants correspond to the following predictions: Q1, proteins predicted to be disordered by CH plots, but ordered by CDFs; Q2, ordered proteins (N); Q3, proteins predicted to be disordered by CDFs, but compact by CH plots (i.e., putative “molten globules”, MG); Q4, proteins predicted to be disordered by both methods (U)
Fig. 4
Fig. 4
Disorder propensity and structural features of the HIV-1 gp120 protein. a Comparison of gp120 Cα B-factors calculated from RMS fluctuations of CONCOORD ensembles between the CD4-complex (solid line), CD4-free (dashed line), and unliganded (gray line) states. The experimentally determined B-factors of the CD4-bound gp120 (PDB entry 1G9M) are shown in gray area. Note that the experimental B-factors of the loops V1/V2, V3, and V4 are missing. The CD4-complexed gp120 is abbreviated to CD4-cplx gp120 and the secondary structure elements and loops V3 and V4 were marked according to the crystal structure of the CD4-bound gp120 [119]. b Disorder prediction evaluated by PONDR® VLXT for the HIV-1 gp120 protein. Red line represents an averaged disorder score for gp120 from ~50 different HIV-1 isolates. Pink shadow covers the distribution of disorder scores calculated for gp120 from these isolates. Gray shaded areas correspond to the mobile loops V1/V2, V3, and VL4. Cyan shaded area shows a CD4 binding loop (residues 332–342). Dark blue lines represent predicted α-MoRFs. c Crystal structure of the HIV-1 gp120 core (light blue ribbon) in complex with a two-domain fragment of CD4 (blue surface) and a neutralizing human antibody dimer (red and gray surfaces) (1GC1). d Crystal structure of the bound form of the HIV-1 gp120 core computationally extracted from its complex with a two-domain fragment of CD4 and a neutralizing human antibody dimer
Fig. 5
Fig. 5
Dynamic nature of the HIV-1 gp120 evidenced by the X-ray and hydrogen–deuterium exchange (HDX) experiments. a Multitude of bound conformations of gp120 in complexes with various binding partners. The unliganded gp120 is shown at the center, whereas surrounding structures represent various liganded forms. All structures (except to 3IDX-b) are shown in (relatively) similar orientations to emphasize the structural diversity of the gp120 bound conformations. 3IDX-a and 3IDX-b represent two different orientations of the bound HIV-gp120 core in complex with the Cd4-binding site antibody b13. In 3IDX-b, gp120 is rotated to visualize a long arm used to bind to b13. b Representation of the local gp120 conformational stability derived from the HDX experiments as mapped onto gp120 crystal structure. Combining HDX-determined stability data with atomic-level structural information allows the local conformational stability of gp120 to be visualized. Energies of HIV-1 gp120 conformational stability for 16 peptic fragments are mapped onto a homology model of unliganded gp120 (top row) and onto the CD4-bound crystal structure of YU2 core gp120 (second row). Structures are displayed in Cα-worm representation. Peptic fragments are colored and numbered according to their positions in sequence, with Cα-worm thicknesses corresponding to energies of conformational stability (as shown in the key on the right). Dotted lines indicate regions that were not measured [120]
Fig. 6
Fig. 6
Disorder propensity and structural features of the HIV-1 gp41 protein. a The X-ray structure of the dimer between the N36 and C34 peptides forming the HIV-1 g41 core (1AIK). b Disorder prediction evaluated by PONDR® VSL2 (top panel) and PONDR® VLXT (bottom panel) for the HIV-1 gp41 protein. Red line represents an averaged disorder score for gp41 from ~50 different HIV-1 isolates. Pink shadow covers the distribution of disorder scores calculated for gp41 from these isolates. Locations of α-helices are indicated by black bars between the panels with the disorder scores. Gray shaded areas correspond to the functional domains of gp41, which, from left to right, are: the N-terminal hydrophobic glycine-rich “fusion” peptide; N51- and C43-peptides, and Kennedy sequence. c and d Side and top views of the crystal structure of a gp41 ectodomain core in its fusion-active state (1DF5). The structure is a six-helix bundle in which an N-terminal trimeric coiled coil is surrounded by three C-terminal outer helices in an antiparallel orientation
Fig. 7
Fig. 7
Disorder propensity and structural features of the HIV-1 p17 matrix protein. a Crystal structure of the p17 hexamer (1HIW). b Crystal structure of the bound form of the HIV-1 p17 computationally extracted from hexamer (1HIW). c NMR solution structure of HIV-1 p17 (2HMX). Five representative members of the conformational ensemble are shown by structures of different color. d Disorder prediction evaluated by PONDR® VSL2 (top panel) and PONDR® VLXT (bottom panel) for the HIV-1 p17 protein. Red line represents an averaged disorder score for p17 from ~50 different HIV-1 isolates. Pink shadow covers the distribution of disorder scores calculated for p17 from these isolates. Locations of α-helices seen in the crystal structure are indicated by black bars between the panels with the disorder scores. Gray shaded areas correspond to the functional domains of p17, which, from left to right, are: trimerization region (residues 42–77) and a disordered C-terminal fragment
Fig. 8
Fig. 8
Disorder propensity and structural features of the HIV-1 capsid protein p24. a NMR solution structure of the p24 NTD (1UPH). Ten representative members of the conformational ensemble are shown by ribbons of different color. b NMR solution structure of the p24 CTD (2JYG). Ten representative members of the conformational ensemble are shown by ribbons of different color. c Crystal structure of p24 monomer (1E6J). d Crystal structure of p24 hexamer (3H47). e Disorder prediction evaluated by PONDR® VSL2 (top panel) and PONDR® VLXT (bottom panel) for the HIV-1 p24 protein. Red line represents an averaged disorder score for p24 from ~50 different HIV-1 isolates. Pink shadow covers the distribution of disorder scores calculated for p24 from these isolates. Locations of α-helices seen in the crystal structure are indicated by black bars between the panels with the disorder scores. Gray shaded areas correspond to the regions of missing electron density. Cyan shaded area shows the location of the CypA binding loop. Dark blue lines represent predicted α-MoRFs
Fig. 9
Fig. 9
Disorder propensity and structural features of the HIV-1 nucleocapsid protein p7. a Solution NMR structure of HIV-1 p7 (1MFS). b Disorder prediction evaluated by PONDR® VSL2 (top panel) and PONDR® VLXT (bottom panel) for the HIV-1 p7 protein. Red line represents an averaged disorder score for p7 from ~50 different HIV-1 isolates. Pink shadow covers the distribution of disorder scores calculated for p7 from these isolates. Locations of α-helices and β-strand seen in the crystal structure are indicated by the black and gray bars, respectively, shown between the panels with the disorder scores. Gray shaded areas correspond to the dynamic 1–13, 32–34, and 52–55 regions of p17. Dark blue lines represent predicted α-MoRFs
Fig. 10
Fig. 10
Disorder propensity and structural features of the HIV-1 proteins p6 and p6*. a Solution NMR structure of HIV-1 p6 (2C55). b Disorder prediction for p6 (red lines) and p6* (red lines) evaluated by PONDR® VSL2 (top panel) and PONDR® VLXT (bottom panel). Locations of the α-helices induced in p6 by TFE are indicated by the black bars shown between the panels with the disorder scores. Gray shaded areas correspond to the N-terminal PTAP motif (residues 7–10) and the functional 32–46 region that contains the LXXLF motif (residues 41–45), the cryptic YPXL-type L-domain (residues 34–46)
Fig. 11
Fig. 11
Disorder propensity and structural features of the HIV-1 protease. a Crystal structure of the PR dimer (3KF1). b Crystal structure of the protease monomer (3HVP). c NMR solution structure of 1–95 fragment of the HIV-1 PR (1Q9P). Ten representative members of the conformational ensemble are shown by ribbons of different color. d Disorder prediction evaluated by PONDR® VSL2 (top panel) and PONDR® VLXT (bottom panel). Red line represents an averaged disorder score for PR from ~50 different HIV-1 isolates. Pink shadow covers the distribution of disorder scores calculated for PR from these isolates. Locations of β-strands and α-helices seen in the crystal structure are indicated by gray and black bars between the panels with the disorder scores. Gray shaded area corresponds to the flap regions of PR
Fig. 12
Fig. 12
Disorder propensity and structural features of the HIV-1 reverse transciptase. a Crystal structure of the p51-p66 heterodimer (1DLO). b Crystal structure of the p51 bound form, which was computationally extracted from the p51-p66 heterodimer structure (1DLO). c Disorder predisposition of the p66 subunit evaluated by PONDR® VSL2 (top panel) and PONDR® VLXT (bottom panel). Red line represents an averaged disorder score for p66 from ~50 different HIV-1 isolates. Pink shadow covers the distribution of disorder scores calculated for p66 from these isolates. Locations of β-strands and α-helices seen in the crystal structure are indicated by gray and black bars between the panels with the disorder scores. Gray shaded area corresponds to the p51 subunit. Dark blue line represents predicted α-MoRF. d NMR solution structure of the RNase H domain of the HIV-1 reverse transcriptase (1O1W). Ten representative members of the conformational ensemble are shown by ribbons of different color
Fig. 13
Fig. 13
Disorder propensity and structural features of the HIV-1 integrase. a Crystal structure of the dimer of a fragment of HIV-1 integrase comprising the N-terminal and catalytic core domains (1K6Y). b Crystal structure of the dimer of a fragment of HIV-1 integrase comprising the catalytic core and C-terminal dimerization domains (1EX4). c Disorder predisposition of IN evaluated by PONDR® VSL2 (top panel) and PONDR® VLXT (bottom panel). Red line represents an averaged disorder score for IN from ~50 different HIV-1 isolates. Pink shadow covers the distribution of disorder scores calculated for IN from these isolates. Locations of β-strands and α-helices seen in the crystal structure are indicated by gray and black bars between the panels with the disorder scores. Gray shaded areas correspond to the N-terminal and C-terminal domains of IN. Yellow shaded areas represent location of regions 47–55, 140–148, and 271–288, which are flexible in the integrase crustal structures. d NMR solution structure of the N-terminal domain of intergrase (1WJD). Five representative members of the conformational ensemble are shown by structures of different color. e NMR solution structure of the C-terminal domain of intergrase (1IHW). Four representative members of the conformational ensemble are shown by ribbons of different color
Fig. 14
Fig. 14
Disorder propensity and structural features of the HIV-1 transactivator of transcription, Tat, protein. a Crystal structure of Tat in a Tat-P-TEFb complex containing HIV-1 Tat, human Cdk9, and human cyclin T1 (also known as CCNT1) (3MI9). Tat is shown as a cyan ribbon, whereas Cdk9 and CCNT1 are shown as red and blue surfaces, respectively. b Crystal structure of Tat (cyan ribbon) in a complex with the cyclin box domain of Cyclin T1 (blue surface) and its corresponding TAR RNA (red surface) (2W2H). c Crystal structure of the P-TEFb-bound Tat (3MI9). d Crystal structure of the Tat bound to the complex of cyclin box domain of Cyclin T1 with TAR RNA (3MI9). e NMR solution structure of the unbound Tat (1TIV). Representative members of the conformational ensemble are shown by ribbons of different color. f Disorder predisposition of Tat evaluated by PONDR® VSL2 (top panel) and PONDR® VLXT (bottom panel). Red line represents an averaged disorder score for Tat from ~50 different HIV-1 isolates. Pink shadow covers the distribution of disorder scores calculated for Tat from these isolates. Locations of α-helices seen in the crystal structure of Tat-P-TEFb complex and a complex of Tat with Cyclin T1 and TAR RNA are respectively indicated by the black and gray crossed bars between the panels with the disorder scores. Dark blue lines show location of the predicted α-MoRFs
Fig. 15
Fig. 15
Disorder propensity and structural features of the HIV-1 Rev protein. a Crystal structure of the Rev dimer containing oligomerization and RNA-binding domains (3LPH). b NMR solution structure of the fragment of Rev bound to the RNA binding Rev peptide in complex with the stem-loop IIB of the Rev-response element (RRE) RNA (1ETF). c Crustal structure of the HIV-1 Rev NES-CRM1-RanGTP complex (3NC0). Here, the Rev fragment is shown as a red ribbon, whereas Exportin-1 and Snurportin-1 are shown as blue and gray surfaces, respectively. d Model structure of RNA-Rev-host export complex. Reproduced with permission from Ref. [306]. e Prediction of intrinsic disorder in Rev by PONDR® VSL2 (top panel) and PONDR® VLXT (bottom panel). Red line represents an averaged disorder score for Rev from ~50 different HIV-1 isolates. Pink shadow covers the distribution of disorder scores calculated for Rev from these isolates. Locations of α-helices seen in the crystal structure of Rev dimer and a complex of Rev with NES-CRM1-RanGTP are respectively indicated by black and gray crossed bars between the panels with the disorder scores. Dark blue lines show location of the predicted α-MoRFs
Fig. 16
Fig. 16
Disorder propensity and structural features of the HIV-1 negative factor (Nef protein). a Crystal structure of the complex between the conserved Nef core (cyan ribbon) and a Src family SH3 domain (blue surface) (1EFN). b NMR solution structure of the unbound Nef core Nef (2NEF). Ten representative members of the conformational ensemble are shown by ribbons of different color. c NMR solution structure of the unbound Nef anchor domain (1QA5). Ten representative members of the conformational ensemble are shown by ribbons of different color. d Structure of HIV-1 Nef protein with some functional annotations discussed in the text. This panel is reproduced with permission from [323]. e Prediction of intrinsic disorder in Nef by PONDR® VSL2 (top panel) and PONDR® VLXT (bottom panel). Red line represents an averaged disorder score for Nef from ~50 different HIV-1 isolates. Pink shadow covers the distribution of disorder scores calculated for Nef from these isolates. Locations of the α-helices seen in NMR structure of the anchor domain are shown by crossed gray bars, whereas gray and black bars between the disorder score panels represent locations of β-strands and α-helices, respectively
Fig. 17
Fig. 17
Disorder propensity and structural features of the HIV-1 viral infectivity factor (Vif protein). a Crystal structure of the Vif peptide 139–179 (which covers the HIV-1 Vif BC and Cullin boxes, cyan ribbon) in association with a complex of human ElonginB (red surface) and ElonginC (blue surface) (3DCG). b Intrinsic disorder prediction in Vif by PONDR® VSL2 (top panel) and PONDR® VLXT (bottom panel). Red line represents an averaged disorder score for Vif from ~50 different HIV-1 isolates. Pink shadow covers the distribution of disorder scores calculated for Vif from these isolates. Location of the α-helix seen in the crystal structure of the Vif-ElonginB-ElonginC complex is shown by the black bar between the disorder score panels. Gray shaded areas correspond to the NTD domain (residues 1–100) that contains an RNA-binding domain, and discontinuous binding sites for A3G and A3F, and to the SOCS box domain (residues 144–173) containing a BC-box region (residues 144–159) and a putative Cullin box (residues 159–173). Dark blue line shows the location of a predicted α-MoRF
Fig. 18
Fig. 18
Disorder propensity and structural features of the HIV-1 viral protein R (Vpr protein). a NMR solution structure of Vpr (1ESX). b NMR solution structure of Vpr (1M8L). c Intrinsic disorder propensities of Vpr evaluated by PONDR® VSL2 (top panel) and PONDR® VLXT (bottom panel). Red line represents an averaged disorder score for Vpr from ~50 different HIV-1 isolates. Pink shadow covers the distribution of disorder scores calculated for Vpr from these isolates. Locations of the α-helixes seen in different NMR structures are shown between the disorder score panels by crossed gray and black bars
Fig. 19
Fig. 19
Disorder propensity and structural features of the HIV-1 viral protein U (Vpu protein). a NMR solution structure of the Vpu transmembrane domain (2GOH). Ten representative members of the conformational ensemble are shown by ribbons of different color. b Molecular dynamics (MD) simulation-based modeling of the average structure of the Vpu transmembrane domain within different membrane environments. The purple rods indicate the principal helical axis. On the left, the upper longer rod lies in the image plane, while the shorter rod is pointing away from the viewer. On the right the view point was rotated by 90°, allowing a view from the side. Reproduced with permission from Ref. [482]. c Models for the tetrameric (a, b), pentameric (c, d), and hexameric (e, f) Vpu TM oligomers that satisfy experimentally derived constraints. Reproduced with permission from Ref. [487]. d NMR solution structure of the cytoplasmic domain of Vpu in the presence dodecylphosphatidyl choline (DPC) micelles (2K7Y). Ten representative members of the conformational ensemble are shown by ribbons of different color. e NMR solution structure of the cytoplasmic domain of Vpu in aqueous solution (1VPU). Ten representative members of the conformational ensemble are shown by ribbons of different color

Similar articles

Cited by

References

    1. Dunker AK, Garner E, Guilliot S, Romero P, Albrecht K, Hart J, Obradovic Z, Kissinger C, Villafranca JE. Protein disorder and the evolution of molecular recognition: theory, predictions and observations. Pac Symp Biocomput. 1998;3:473–484. - PubMed
    1. Wright PE, Dyson HJ. Intrinsically unstructured proteins: re-assessing the protein structure-function paradigm. J Mol Biol. 1999;293(2):321–331. doi: 10.1006/jmbi.1999.3110. - DOI - PubMed
    1. Uversky VN, Gillespie JR, Fink AL. Why are “natively unfolded” proteins unstructured under physiologic conditions? Proteins. 2000;41(3):415–427. doi: 10.1002/1097-0134(20001115)41:3<415::AID-PROT130>3.0.CO;2-7. - DOI - PubMed
    1. Dunker AK, Lawson JD, Brown CJ, Williams RM, Romero P, Oh JS, Oldfield CJ, Campen AM, Ratliff CM, Hipps KW, Ausio J, Nissen MS, Reeves R, Kang C, Kissinger CR, Bailey RW, Griswold MD, Chiu W, Garner EC, Obradovic Z. Intrinsically disordered protein. J Mol Graph Model. 2001;19(1):26–59. doi: 10.1016/S1093-3263(00)00138-8. - DOI - PubMed
    1. Tompa P. Intrinsically unstructured proteins. Trends Biochem Sci. 2002;27(10):527–533. doi: 10.1016/S0968-0004(02)02169-2. - DOI - PubMed

Publication types

Substances

LinkOut - more resources