Timing of fructose intake: an important regulator of adiposity
- PMID: 22032284
- PMCID: PMC4078737
- DOI: 10.1111/j.1440-1681.2011.05636.x
Timing of fructose intake: an important regulator of adiposity
Abstract
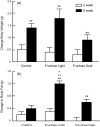
1. Overconsumption of fructose produces glucose intolerance, autonomic abnormalities and renal dysfunction and may be related to the worldwide epidemic of obesity and diabetes. 2. Experiments were conducted to determine whether the time period (light or dark) of fructose consumption influenced the pathological consequences. C57BL mice were given standard chow and assigned to one of three groups: (i) control (n = 10), which received water over a 24 h period; (ii) FL (n = 11), which received 10% fructose solution during the 12 h light period; and (iii) FD (n = 11), which received 10% fructose solution during the 12 h dark period. 3. There was a time related increase in body weight for all groups (P < 0.01, 2 vs 6 wks). There was a greater increase in body fat in the FL group compared with the control and FD groups. The changes in adiposity occurred even though the total caloric intake was not significantly different among the groups (approximately 18 kcal/day). Total fluid (water + fructose) consumption was greater in the FD and FL groups compared with control at 6 weeks. Significant increases were noted for plasma insulin and leptin at 8 weeks, with highest levels in the FL compared with FD group (P < 0.05). There were no significant changes in glucose, glucose tolerance, cholesterol, triglycerides or adiponectin. 4. The results of the present study suggest that there is a mismatch in caloric consumption, metabolism and adiposity as related to the light-dark cycle of fructose consumption. These findings have clinical implications in the control of bodyweight, abdominal fat accumulation and Type 2 diabetes.
© 2011 The Authors. Clinical and Experimental Pharmacology and Physiology © 2011 Blackwell Publishing Asia Pty Ltd.
Figures


Similar articles
-
Effects of sugar-sweetened beverages on plasma acylation stimulating protein, leptin and adiponectin: relationships with metabolic outcomes.Obesity (Silver Spring). 2013 Dec;21(12):2471-80. doi: 10.1002/oby.20437. Epub 2013 Jun 13. Obesity (Silver Spring). 2013. PMID: 23512943 Free PMC article.
-
High-fructose diet in pregnancy leads to fetal programming of hypertension, insulin resistance, and obesity in adult offspring.Am J Obstet Gynecol. 2016 Sep;215(3):378.e1-6. doi: 10.1016/j.ajog.2016.03.038. Epub 2016 Apr 7. Am J Obstet Gynecol. 2016. PMID: 27060421
-
Fat-enriched rather than high-fructose diets promote whitening of adipose tissue in a sex-dependent manner.J Nutr Biochem. 2017 Nov;49:22-29. doi: 10.1016/j.jnutbio.2017.07.009. Epub 2017 Jul 24. J Nutr Biochem. 2017. PMID: 28863366
-
Fructose, weight gain, and the insulin resistance syndrome.Am J Clin Nutr. 2002 Nov;76(5):911-22. doi: 10.1093/ajcn/76.5.911. Am J Clin Nutr. 2002. PMID: 12399260 Review.
-
Fructose-induced inflammation and increased cortisol: A new mechanism for how sugar induces visceral adiposity.Prog Cardiovasc Dis. 2018 May-Jun;61(1):3-9. doi: 10.1016/j.pcad.2017.12.001. Epub 2017 Dec 8. Prog Cardiovasc Dis. 2018. PMID: 29225114 Review.
Cited by
-
Way back for fructose and liver metabolism: bench side to molecular insights.World J Gastroenterol. 2012 Dec 7;18(45):6552-9. doi: 10.3748/wjg.v18.i45.6552. World J Gastroenterol. 2012. PMID: 23236229 Free PMC article. Review.
-
Effects of restricted fructose access on body weight and blood pressure circadian rhythms.Exp Diabetes Res. 2012;2012:459087. doi: 10.1155/2012/459087. Epub 2012 Mar 29. Exp Diabetes Res. 2012. PMID: 22536215 Free PMC article.
-
Early developmental exposure to high fructose intake in rats with NaCl stimulation causes cardiac damage.Eur J Nutr. 2016 Feb;55(1):83-91. doi: 10.1007/s00394-014-0826-5. Epub 2015 Jan 7. Eur J Nutr. 2016. PMID: 25564432
-
Impact of nutrients on circadian rhythmicity.Am J Physiol Regul Integr Comp Physiol. 2015 Mar 1;308(5):R337-50. doi: 10.1152/ajpregu.00322.2014. Epub 2014 Dec 17. Am J Physiol Regul Integr Comp Physiol. 2015. PMID: 25519730 Free PMC article. Review.
-
Potential Crosstalk between Fructose and Melatonin: A New Role of Melatonin-Inhibiting the Metabolic Effects of Fructose.Int J Endocrinol. 2018 Aug 1;2018:7515767. doi: 10.1155/2018/7515767. eCollection 2018. Int J Endocrinol. 2018. PMID: 30154843 Free PMC article. Review.
References
-
- Johnson RK, Appel LJ, Brands M, et al. Dietary sugars intake and cardiovascular health: a scientific statement from the American Heart Association. Circulation. 2009;120:1011–20. - PubMed
-
- Schulze MB, Manson JE, Ludwig DS, et al. Sugar-sweetened beverages, weight gain, and incidence of type 2 diabetes in young and middle-aged women. JAMA. 2004;292:927–34. - PubMed
-
- Dhingra R, Sullivan L, Jacques PF, et al. Soft drink consumption and risk of developing cardiometabolic risk factors and the metabolic syndrome in middle-aged adults in the community. Circulation. 2007;116:480–88. - PubMed
-
- Nielsen SJ, Siega-Riz AM, Popkin BM. Trends in energy intake in U.S. between 1977 and 1996: similar shifts seen across age groups. Obes.Res. 2002;10:370–78. - PubMed
Publication types
MeSH terms
Substances
Grants and funding
LinkOut - more resources
Full Text Sources

