. 2011 Nov 21;208(12):2465-76.
doi: 10.1084/jem.20110434. Epub 2011 Oct 24.

Th17 lymphocytes traffic to the central nervous system independently of α4 integrin expression during EAE

Affiliations

Th17 lymphocytes traffic to the central nervous system independently of α4 integrin expression during EAE

Veit Rothhammer et al. J Exp Med. .

Abstract

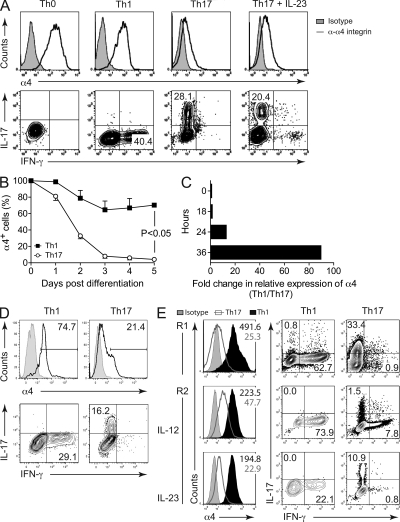
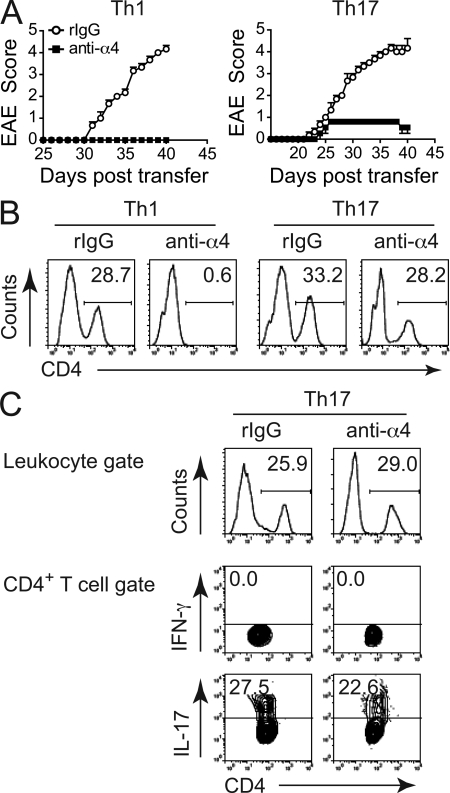
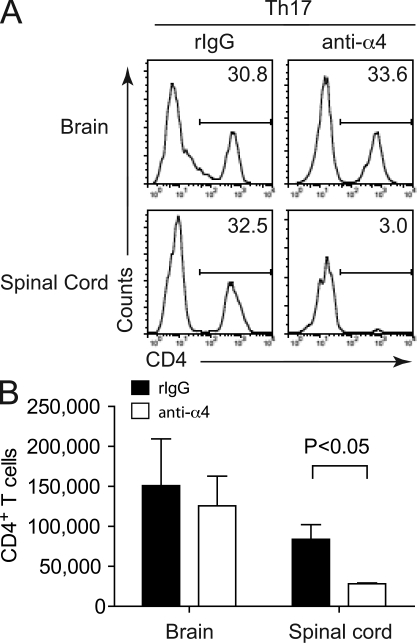
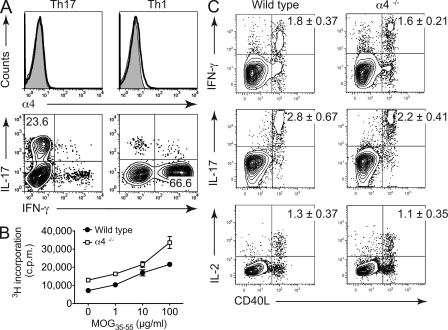
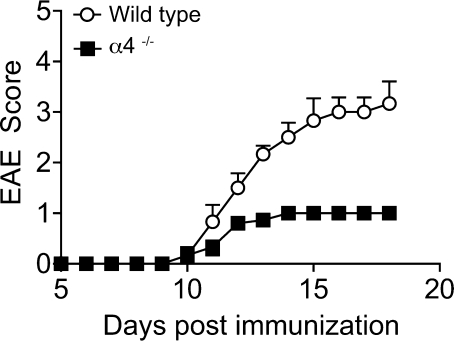
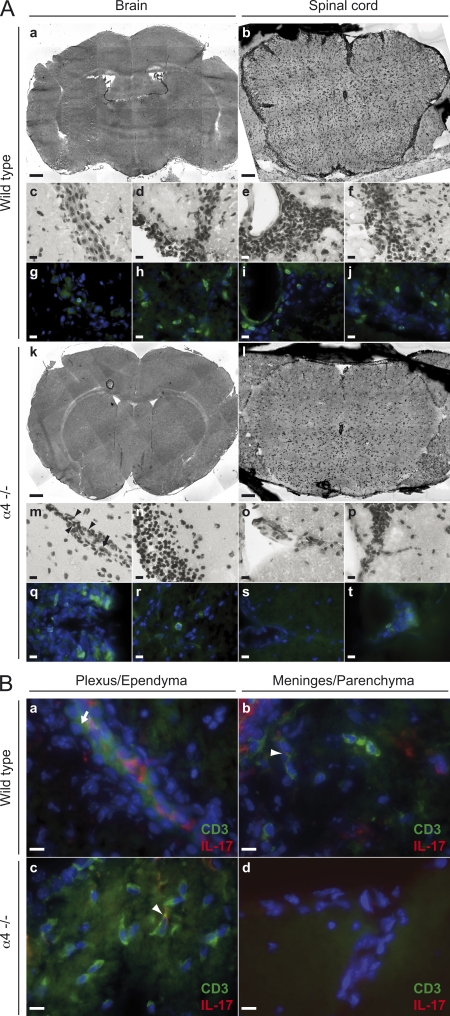
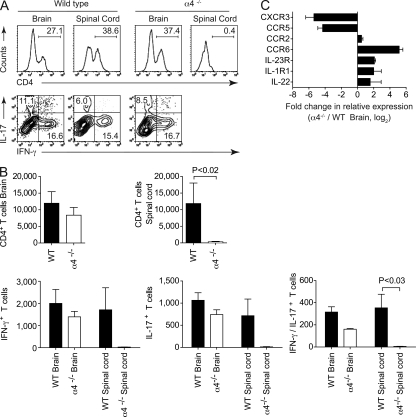
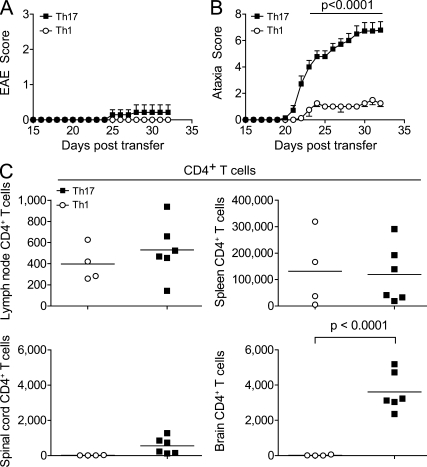
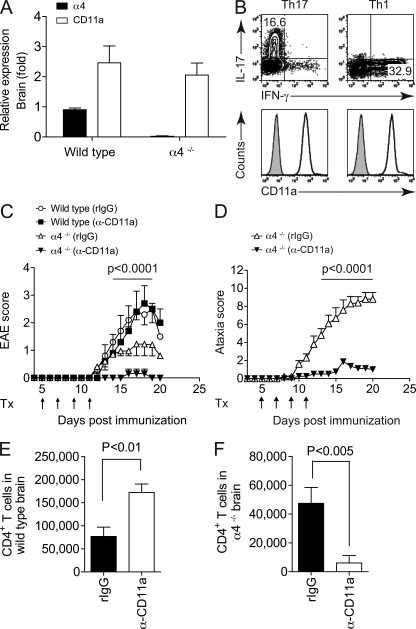
The integrin α4β1 (VLA-4) is used by encephalitogenic T cells to enter the central nervous system (CNS). However, both Th1 and Th17 cells are capable of inducing experimental autoimmune encephalomyelitis (EAE), and the molecular cues mediating the infiltration of Th1 versus Th17 cells into the CNS have not yet been defined. We investigated how blocking of α4 integrins affected trafficking of Th1 and Th17 cells into the CNS during EAE. Although antibody-mediated inhibition of α4 integrins prevented EAE when MOG(35-55)-specific Th1 cells were adoptively transferred, Th17 cells entered the brain, but not the spinal cord parenchyma, irrespective of α4 blockade. Accordingly, T cell-conditional α4-deficient mice were not resistant to actively induced EAE but showed an ataxic syndrome with predominantly supraspinal infiltrates of IL-23R(+)CCR6(+)CD4(+) T cells. The entry of α4-deficient Th17 cells into the CNS was abolished by blockade of LFA-1 (αLβ2 integrin). Thus, Th1 cells preferentially infiltrate the spinal cord via an α4 integrin-mediated mechanism, whereas the entry of Th17 cells into the brain parenchyma occurs in the absence of α4 integrins but is dependent on the expression of αLβ2. These observations have implications for the understanding of lesion localization, immunosurveillance, and drug design in multiple sclerosis.


Figures

Figure 1.
Figure 1.
Expression of α4 integrin mRNA and protein are down-regulated in Th17 cells. (A) Purified naive T cells (CD4+CD44Foxp3) isolated from Foxp3gfp.KI mice were cultured under Th0 (no cytokines), Th1 (IL-12 and anti–IL-4), or Th17 (TGF-β plus IL-6 ± IL-23) polarizing conditions with polyclonal TCR stimulation. On day 3, expression of α4 integrin was determined by surface staining (top row: tinted line, isotype control; black line, α-α4 integrin). The differentiation status was confirmed by intracellular cytokine staining (bottom row: numbers indicate percentages of cytokine-positive cells). Shown are representatives of more than five independent experiments. (B) Time course of α4 integrin expression during Th1 and Th17 differentiation as determined by surface staining (means + SD, n = 4, Student’s t test). (C) RNA was isolated from T cells that had been stimulated under Th1 or Th17 polarizing conditions at indicated time points. Relative expression of α4 integrin was determined by quantitative RT-PCR analysis. Bars indicate fold change in relative expression of α4 integrin in Th1 versus Th17 cells. Shown are representatives of four independent experiments. (D) Naive T cells (CD4+CD44Foxp3) from 2D2 × Foxp3gfp.KI MOG35-55-specific TCR transgenic mice were cultivated 1:5 with irradiated syngeneic splenocytes as APCs and 20 µg/ml MOG35-55 peptide under Th1 or Th17 polarizing conditions, respectively. α4 integrin expression and cytokine status were determined on day 4 after the start of differentiation by flow cytometry. Shown are representatives of two independent experiments. (E) Naive (CD4+CD44CD25) T cells were FACS sorted and polarized under Th1 or Th17 conditions (R1). After a resting phase, T cells were restimulated by plate-bound anti-CD3 and soluble anti-CD28 antibodies in the presence of IL-12 or IL-23 (R2) and allowed to proliferate for another 3 d before analyzing the expression levels of surface α4 integrin and intracellular IL-17 and IFN-γ by flow cytometry (numbers indicate percentages of cytokine-positive cells). In the histogram plots, numbers indicate mean fluorescence intensity (MFI) of α4 integrin surface expression in Th1 (black numbers) or Th17 cells (gray numbers), respectively. Shown are representatives of two independent experiments.
Figure 2.
Figure 2.
In adoptive transfer EAE, antigen-specific Th17, but not Th1, cells enter into CNS independently of α4 blockade. (A) Naive CD4+CD44CD25 T cells from 2D2 MOG35-55-specific TCR transgenic mice were polarized under Th1 or Th17 conditions in vitro. On day 3, cytokine status was checked by intracellular cytokine staining and 2 × 10⁶ cytokine-positive cells were injected i.v. into Rag1−/− mice. Before injection, polarized cells were incubated with control Ig or blocking antibodies to α4 integrin (PS/2). According to the pretreatment of the transferred cells, host mice were administered rIgG or anti-α4 antibody every 3 d until the development of disease. Means of clinical scores +SEM, n = 4. Note that host mice that received Th17 cells under conditions of α4 blockade developed signs of atypical EAE with ataxia and hemiparesis. (B) At the peak of disease, mononuclear cells were isolated from the CNS of individual mice, stained for CD3 and CD4, and analyzed by flow cytometry. Numbers in the histograms represent percentages of CD4+ T cells among CNS-infiltrating mononuclear cells. Shown are representatives of six independent experiments. (C) MOG35-55-specific TCR transgenic 2D2 mice were crossed to Ifng−/− mice. Naive T cells were differentiated under Th17 conditions and transferred into Rag1−/− mice, which were then treated with rIgG or blocking antibodies to α4 integrin. CNS-infiltrating mononuclear cells were isolated at the peak of disease and stained for surface and intracellular antigens as indicated. Shown are representatives of three independent experiments.
Figure 3.
Figure 3.
Encephalitogenic Th17 cells enter supraspinal parts of the CNS but fail to migrate into the spinal cord when α4 integrins are blocked. (A) Naive T cells from 2D2 mice were differentiated into Th17 cells in vitro and transferred into Rag1−/− mice, which were treated with control rIgG or blocking antibodies to α4 integrin (see Fig. 2). At the peak of disease, the CNS was prepared and dissected into brain (brain stem, cerebellum, and cerebrum) and spinal cord. Mononuclear cells were isolated separately and analyzed by flow cytometry. Numbers indicate percentages of CD3+CD4+ T cells within the live mononuclear cell compartment. Shown are representatives of five independent experiments. (B) Quantification of absolute numbers of CD3+CD4+ T cells infiltrating brain or spinal cord under treatment with control rIgG or antibodies to α4 (mean + SD, n = 4).
Figure 4.
Figure 4.
T cell differentiation and antigen-specific proliferation is not impaired in CD4 Cre × α4flox/flox mice. We generated T cell conditional α4 integrin knockout mice (α4−/−) by crossing CD4 Cre mice with α4flox/flox mice. (A) Naive T cells (CD4+CD44CD25) from α4−/− mice were isolated by FACS sorting and differentiated in vitro by stimulation with anti-CD3/anti-CD28 under Th1 or Th17 polarizing conditions. Surface staining for α4 integrin (top row: tinted line, isotype control; black line, anti–α4 integrin) and intracellular cytokine staining for IL-17 and IFN-γ (bottom row) are depicted. Numbers indicate percentages of cytokine-positive cells. Shown are representatives of three independent experiments. (B and C) α4−/− mice and wild-type littermates were immunized with MOG35-55 in CFA. On day 8, draining lymph nodes were dissected and restimulated with MOG35-55 in vitro. After 48 h, the antigen-specific proliferative response was determined by 3H-thymidine incorporation (B, means + SD, n = 3). (C) Fractions of antigen-specific cytokine-producing CD4+ T cells in draining lymph nodes of MOG35-55-immunized wild-type and conditional α4−/− mice were determined by intracellular CD40L (CD154) and cytokine staining after restimulation with MOG35-55. Numbers indicate percentages of cytokine/CD40L double-positive cells (C, means ± SEM, n = 3).
Figure 5.
Figure 5.
α4−/− mice develop atypical EAE. EAE was induced in α4−/− mice or wild-type control animals by immunization with MOG35-55 in CFA and disease severity was monitored according to the classical EAE score (mean clinical score + SEM, n = 5). Note that α4−/− mice developed an ataxic EAE syndrome whose severity is only partially reflected in the classical EAE score.
Figure 6.
Figure 6.
α4−/− mice develop atypical EAE as a result of predominant cerebral immune cell infiltration. At the peak of disease (i.e., on day 18 after immunization), coronal brain sections and transverse lumbar spinal cord sections were prepared from MOG35-55-immunized wild-type and α4−/− mice. (A) Light microscopy of sections stained with hematoxylin and eosin (a–f and k–p) and immunofluorescence imaging of sections stained for CD3 (green, g–j and q–t). Note that there were hardly any CD3+ T cells in the plexus epithelium of wild-type mice (c and g), whereas inflammatory infiltrates were identified beneath the glia limitans (d and h). In contrast, α4−/− animals showed T cells associated with the plexus epithelium (m and q) as well as the meninges (n and r). The arrowheads in m indicate inflammatory cells associated with ventricular epithelium lining. The arrow in m designates a ventricular epithelium lining cell. (B) Double immunofluorescence staining for CD3 (green) and IL-17 (red) in cryosections from wild-type (a and b) and α4−/− EAE mice (c and d). Nuclear staining with DAPI is shown (blue). IL-17–producing T cells (yellow, arrowheads in b and c) were identified in meningeal infiltrates of wild-type mice (b) and in the periventricular infiltrates of α4−/− animals (c). The arrow in a indicates a plexus epithelium cell. Bars: (A, a and k): 500 µm; (A, b and l) 125 µm; (A, c–j and m–t; B, a–d) 10 µm.
Figure 7.
Figure 7.
Flow cytometric analysis of CNS-infiltrating T cells in MOG35-55-immunized wild-type versus α4−/− mice at the peak of EAE. Wild-type and α4−/− mice were immunized with MOG35-55 plus CFA and, at the peak of disease, cerebrum and spinal cord were analyzed separately. (A) Fraction and cytokine profile of CNS-infiltrating CD3+CD4+ T cells. Numbers indicate percentages of CD4+ T cells among live mononuclear cells (top row) or percentages of cytokine-positive cells within the CD3+CD4+ T cell compartment (bottom row, representative of five independent experiments). (B) Absolute number of CD4+ T cells within the brain (top row, left) or spinal cord (top row, right) of wild-type or α4−/− EAE mice. In the bottom row, absolute numbers of IFN-γ, IL-17, or IFN-γ/IL-17 double-positive CD4+ T cells recovered from the brain or spinal cord of wild-type versus α4−/− mice are depicted (means + SD, n = 5). (C) CD3+CD4+ T cells were highly purified by FACS sorting from supraspinal parts of the CNS (brain, i.e. brain stem, cerebellum, and cerebrum) of MOG35-55-immunized wild-type or α4−/− mice at the peak of disease. Fold change in relative abundance of Cxcr3, Ccr5, Ccr2, Ccr6, Il23r, Il1r1, and IL-22 mRNA in α4−/− versus wild-type control mice (log scale, means + SD, n = 3).
Figure 8.
Figure 8.
Adoptive transfer of α4-deficient MOG35-55-specific TCR transgenic T cells (2D2) into Rag1−/− mice after in vitro polarization into Th1 or Th17 cells. Naive T cells from 2D2 × CD4 Cre × α4flox/flox mice (α4−/− 2D2) were differentiated into Th1 or Th17 cells in vitro and transferred into Rag1−/− recipient mice. The host mice were followed clinically according to the classical EAE score (A) and according to an ataxia score (B). Means of clinical scores + SEM for classical and ataxic EAE are depicted (two-way ANOVA plus Bonferroni’s post-testing). (C) At the peak of disease, lymph nodes, spleens, spinal cords, and brains (i.e. brain stem, cerebellum, and cerebrum) were dissected. Mononuclear cells were isolated separately and analyzed by flow cytometry. Quantification of absolute numbers of α4-deficient 2D2 CD3+CD4+ T cells in lymph nodes and spleen (C, top row) and in spinal cord and brain (C, bottom row) reisolated from individual host mice (Student’s t test). Horizontal bars indicate mean.
Figure 9.
Figure 9.
Atypical EAE in α4−/− mice and predominant cerebral T cell infiltration are inhibited by administration of blocking antibodies to CD11a (αL integrin). EAE was induced in wild-type and T cell conditional α4−/− mice by immunization with MOG35-55 plus CFA. (A) Relative expression of α4 integrin and CD11a (αL integrin) in CD4+ T cells isolated from the brain of untreated wild-type or α4−/− EAE mice (means + SD, n = 3). (B) Naive wild-type T cells were cultured under Th1 or Th17 polarizing conditions. On day 4, intracellular cytokine staining and surface staining for CD11a (tinted histogram, isotype control; black line, anti-CD11a expression) were performed. Shown are representatives of two independent experiments. (C and D) Starting from day 5 after induction of EAE in wild-type and α4−/− mice, control rat IgG or antibodies to CD11a were administered i.p. every other day until the development of clinical signs of disease. (C) Means of clinical scores + SEM are depicted according to the classical EAE score (n = 6). The rat IgG control-treated and anti-CD11a–treated α4−/− groups were compared with two-way ANOVA and Bonferroni’s post-testing. (D) Treatment effect of anti-CD11a in α4−/− mice according to the ataxia score (mean + SEM, n = 4). The two groups were compared with two-way ANOVA and Bonferroni’s post-testing. (E and F) Absolute numbers of brain-infiltrating T cells isolated at the peak of disease from wild-type (E) and α4−/− mice (F) without or with anti-CD11a treatment (means + SD of absolute CD4+ T cell numbers, n = 6, Student’s t test).

Similar articles

Cited by

References

    1. Archelos J.J., Jung S., Mäurer M., Schmied M., Lassmann H., Tamatani T., Miyasaka M., Toyka K.V., Hartung H.P. 1993. Inhibition of experimental autoimmune encephalomyelitis by an antibody to the intercellular adhesion molecule ICAM-1. Ann. Neurol. 34:145–154 10.1002/ana.410340209 - DOI - PubMed
    1. Awasthi A., Riol-Blanco L., Jäger A., Korn T., Pot C., Galileos G., Bettelli E., Kuchroo V.K., Oukka M. 2009. Cutting edge: IL-23 receptor gfp reporter mice reveal distinct populations of IL-17-producing cells. J. Immunol. 182:5904–5908 10.4049/jimmunol.0900732 - DOI - PMC - PubMed
    1. Barnett M., Prineas J., Buckland M., Parratt J., Pollard J. 2011. Massive astrocyte destruction in neuromyelitis optica despite natalizumab therapy. Mult. Scler. - PubMed
    1. Baron J.L., Madri J.A., Ruddle N.H., Hashim G., Janeway C.A., Jr 1993. Surface expression of α4 integrin by CD4 T cells is required for their entry into brain parenchyma. J. Exp. Med. 177:57–68 10.1084/jem.177.1.57 - DOI - PMC - PubMed
    1. Bartholomäus I., Kawakami N., Odoardi F., Schläger C., Miljkovic D., Ellwart J.W., Klinkert W.E., Flügel-Koch C., Issekutz T.B., Wekerle H., Flügel A. 2009. Effector T cell interactions with meningeal vascular structures in nascent autoimmune CNS lesions. Nature. 462:94–98 10.1038/nature08478 - DOI - PubMed

Publication types

Substances