. 2011 Oct 18;20(4):500-10.
doi: 10.1016/j.ccr.2011.08.023.

The metabolic regulator ERRα, a downstream target of HER2/IGF-1R, as a therapeutic target in breast cancer

Affiliations

The metabolic regulator ERRα, a downstream target of HER2/IGF-1R, as a therapeutic target in breast cancer

Ching-yi Chang et al. Cancer Cell. .

Abstract

A genomic signature designed to assess the activity of the estrogen-related receptor alpha (ERRα) was used to profile more than 800 breast tumors, revealing a shorter disease-free survival in patients with tumors exhibiting elevated receptor activity. Importantly, this signature also predicted the ability of an ERRα antagonist, XCT790, to inhibit proliferation in cellular models of breast cancer. Using a chemical genomic approach, it was determined that activation of the Her2/IGF-1R signaling pathways and subsequent C-MYC stabilization upregulate the expression of peroxisome proliferator-activated receptor gamma coactivator-1 beta (PGC-1β), an obligate cofactor for ERRα activity. PGC-1β knockdown in breast cancer cells impaired ERRα signaling and reduced cell proliferation, implicating a functional role for PGC-1β/ERRα in the pathogenesis of breast cancers.


Figures

Figure 1
Figure 1. Expression of ERRα-regulated genes clusters tumor samples into clinically distinct groups
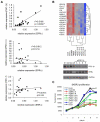
(A, C) Unsupervised hierarchical clustering of tumor samples in 2 clinical datasets using 448 ERRα-regulated probesets. The order of probesets in the Uppsala dataset was fixed to match that in the Rotterdam clustering diagram to reveal common patterns of gene regulation in these two clinical datasets. Hierarchical clustering revealed that the expression pattern of ERRα-regulated genes in clinical samples separates the genes into 4 different clusters (boxed and labeled 1, 2, 3, and 4). (B, D) Relapse-free survival was plotted for patients in the right branch vs. patients in the left branch. Kaplan-Meier curves were generated using GraphPad Prism and p-value was determined by log-rank test. See also Figure S1.
Figure 2
Figure 2. Correlations between posterior probabilities of ERRα activation (as predicted by the cluster 3 classifier) and relapse-free survival in seven clinical datasets
“Low ERR” and “High ERR” groups represent tumor samples with the posterior probability of ERRα activation lower than the mean and higher than the mean for that dataset. Significance was determined by log-rank test. The predictability of cluster 3 ERRα classifier was validated in two independent datasets (Figure S2). See also Table S1 and S2.
Figure 3
Figure 3. The sensitivity of breast cancer cells to ERRα antagonist correlates with their intrinsic cluster 3 ERRα activity
Seventeen breast cancer cell lines with predicted high, medium, and low levels of ERRα activity were treated with an ERRα antagonist XCT790 and their growth inhibitory responses (% inhibition) to these compounds were plotted against the ERRα activity (average med p) of each cell line predicted using gene expression data derived from each cluster defined in Figure 1. Linear regression and p-values were determined using the GraphPad Prism software. The percent inhibition was presented as mean +/− SEM from four independent experiments. See also Table S3, S4 and Figure S3.
Figure 4
Figure 4. PGC-1β is important for maintaining ERRα activity in breast cancer cells
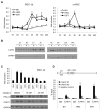
(A) RNA from nineteen breast cancer cell lines was harvested and the expression of ERRα, PGC-1β, PGC-1α and PRC-1 was assessed by qPCR. The relative expression values of each gene of interest in SKBR3 cells were set as 1. The data shown is representative of two independent experiments. Correlation analysis was performed using GraphPad Prizm software. (B) The expression of ERRα target genes in SKBR3 was assessed following the knockdown of ERRα (siERRα) or PGC-1β (siPGC1β A, C, D and E). Control siRNA (low31, med483), mock transfection (mock) and DMSO treatment were included as negative controls. XCT790 treatment (10 μM) was used as a positive control. The data shown is representative of three independent experiments. The right panel shows the Western blot analysis demonstrating the knockdown of ERRα and PGC-1β at the protein levels. GAPDH was used as a loading control. “siE” denotes siERRα. (C) SKBR3 cells were transfected as in (B) and seeded in 96-well plates. Cells were harvested 1, 3, 5, 7, 9 and 11 days after transfection and cell numbers were determined by staining with the DNA dye Hoechst 33258. The data shown are representative of three independent experiments. See also Figure S4 and Table S5.
Figure 5
Figure 5. PI3K inhibitors attenuates ERRα activity in breast cancer cells
(A) SKBR3 breast cancer cells were treated with vehicle, 5 and 10 μM XCT790, or 1 and 2 μM wortmannin for 24h. RNA was harvested and the expression of ERRα target genes was analyzed by qPCR. Ward hierarchical analysis and heat maps were generated using the JMP software. (B) SKBR3 cells were treated as in (A) and the expression of PGC-1β was analyzed by qPCR. (C) SKBR3 cells were treated with 20 μM LY294002, 10 μM U0126 or 0.2 μM of the Akt inhibitor GSK716166B for 24h. RNA was harvested and the expression of PGC-1β was analyzed by qPCR. 36B4 was used as an internal normalization control for each sample and the relative expression of each gene in compound- vs. DMSO-treated samples was expressed as fold induction +/− SD. The data shown are representative of at least three independent experiments. See also Table S6.
Figure 6
Figure 6. Her2 signaling pathway regulates ERRα activity partially through modulating the expression of PGC-1β
SKBR3, BT474, and AU565 cells (Her2-amplified) and BT483 breast cancer cells (not Her2-amplified) were treated with vehicle or 0.5 and 1μM of the dual EGFR/Her2 inhibitor GW2974 for 24h. RNA was harvested and the expression of IDH3A (ERRα target gene), PGC-1β, PGC-1α, and an unrelated coactivator SRC2 were analyzed by qPCR. 36B4 was used an internal normalization control for each sample and the ratio of each gene in compound- vs. DMSO-treated samples was expressed as relative expression (the expression values of DMSO treated samples of each cell line was set to 1). The data shown are average +/− SEM of three independent experiments. “ND” stands for not detectable. See also Figure S5.
Figure 7
Figure 7. Activation of Her2 or IGF-1 signaling pathways enhances the expression of PGC-1β
(A) MCF7 breast cancer cells were serum starved for 24h and then treated with vehicle or 100 ng/ml of the indicated growth factors for 8h. RNA was harvested and the expression of PGC-1β was analyzed by qPCR. (B) MCF7 cells were treated as in (A) and whole cell extracts were collected 8 and 25h after growth factor stimulation. Western immunoblot was used to determine the expression of PGC-1β. GAPDH was used as a loading control. (C) MCF7 cells were serum starved and pre-treated for 1h with various kinase inhibitors followed by 8h treatment with vehicle, heregulin or IGF-1. RNA was harvested and the expression of PGC-1β was analyzed by qPCR. For all qPCR analysis, 36B4 was used an internal normalization control for each sample and the relative expression of each gene in treatment vs. vehicle-treated samples was expressed as average fold induction +/− SD. The data shown are representative of at least three independent experiments. See also Figure S6.
Figure 8
Figure 8. C-MYC integrates IGF-1 and Her2 signaling to activate the transcription of PGC-1β
MCF7 breast cancer cells were serum starved for 24h and then treated with vehicle or 100 ng/ml of the indicated growth factors for different time points. RNA and protein were harvested. The expression of PGC-1β and C-MYC transcripts was analyzed by qPCR (A) and the expression of C-MYC proteins was assessed by western immunoblots (B). (C) MCF7 cells were serum starved and pre-treated with 10 or 25 mM of the C-MYC inhibitor 10058-F4, followed by 8h treatment with vehicle, heregulin (HRG) or IGF-1. RNA and whole cell extracts were collected and the expression of PGC-1β RNA and protein, as well as C-MYC protein was analyzed. For all qPCR analysis, 36B4 was used an internal normalization control for each sample and the relative expression of each gene in treatment vs. vehicle-treated samples was expressed as fold induction +/− SD. The data shown are representative of at least three independent experiments. (D) MCF7 cells were serum starved; treated with vehicle, HRG or IGF-1 for 90 min; and the chromatin was cross-linked with formaldehyde. Chromatin immunoprecipitation was performed using either an IgG control or an antibody that recognizes C-MYC. Precipitated chromatin was reverse cross-linked and quantitated by qPCR using primers spanning the putative C-MYC binding sites in the intron 1 of PGC-1β. See also Figure S7.

Similar articles

Cited by

References

    1. Ao A, Wang H, Kamarajugadda S, Lu J. Involvement of estrogen-related receptors in transcriptional response to hypoxia and growth of solid tumors. Proc Natl Acad Sci U S A. 2008;105:7821–7826. - PMC - PubMed
    1. Arany Z, Foo SY, Ma Y, Ruas JL, Bommi-Reddy A, Girnun G, Cooper M, Laznik D, Chinsomboon J, Rangwala SM, et al. HIF-independent regulation of VEGF and angiogenesis by the transcriptional coactivator PGC-1alpha. Nature. 2008;451:1008–1012. - PubMed
    1. Ariazi EA, Clark GM, Mertz JE. Estrogen-related receptor alpha and estrogen-related receptor gamma associate with unfavorable and favorable biomarkers, respectively, in human breast cancer. Cancer Res. 2002;62:6510–6518. - PubMed
    1. Ariazi EA, Kraus RJ, Farrell ML, Jordan VC, Mertz JE. Estrogen-related receptor alpha1 transcriptional activities are regulated in part via the ErbB2/HER2 signaling pathway. Mol Cancer Res. 2007;5:71–85. - PubMed
    1. Bauer DE, Hatzivassiliou G, Zhao F, Andreadis C, Thompson CB. ATP citrate lyase is an important component of cell growth and transformation. Oncogene. 2005;24:6314–6322. - PubMed

Publication types

MeSH terms

Associated data