. 2011 Oct 18;20(4):457-71.
doi: 10.1016/j.ccr.2011.09.001.

Androgen receptor gene expression in prostate cancer is directly suppressed by the androgen receptor through recruitment of lysine-specific demethylase 1

Affiliations

Androgen receptor gene expression in prostate cancer is directly suppressed by the androgen receptor through recruitment of lysine-specific demethylase 1

Changmeng Cai et al. Cancer Cell. .

Abstract

Androgen receptor (AR) is reactivated in castration-resistant prostate cancer (CRPC) through mechanisms including marked increases in AR gene expression. We identify an enhancer in the AR second intron contributing to increased AR expression at low androgen levels in CRPC. Moreover, at increased androgen levels, the AR binds this site and represses AR gene expression through recruitment of lysine-specific demethylase 1 (LSD1) and H3K4me1,2 demethylation. AR similarly represses expression of multiple genes mediating androgen synthesis, DNA synthesis, and proliferation while stimulating genes mediating lipid and protein biosynthesis. Androgen levels in CRPC appear adequate to stimulate AR activity on enhancer elements, but not suppressor elements, resulting in increased expression of AR and AR repressed genes that contribute to cellular proliferation.


Figures

Figure.1
Figure.1. Androgen decreases AR protein expression in VCaP cells
(A) LNCaP, CWR22Rv1, LAPC4 or VCaP cells were treated with 0, 1, or 10 nM DHT for 24h and AR or β-actin were immunoblotted. (B) VCaP cells were treated with/out DHT for 4h, 8h, or 24h and AR, PSA, or β-actin were immunoblotted. (C) VCaP cells were treated with 0, 0.1, 1, or 10 nM DHT and with 0, 10, or 40 μM bicalutamide for 24h and immunobloted for AR, Ser 81 phosphorylated AR, PSA, or β-actin. (D) VCaP or LNCaP cells were pre-treated with/out 10 nM DHT for 24h and then treated with MG115/MG132 for 4h. (E) VCaP or LNCaP cells were pre-treated with/out DHT for 2h and then treated with cycloheximide (10 ng/mL) for 0, 2, 4, or 6h. (F) VCaP or LNCaP cells were transiently transfected with empty vector or 3×Flag-AR. After 24h, cells were treated with/out 10 nM DHT for 24h (note: the prostate cancer cells were steroid-depleted by culturing in medium with charcoal/dextran stripped serum, CSS, for 3d before treatments in all experiments). See also Figure S1.
Figure.2
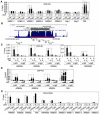
Figure.2. Agonist-liganded AR negatively regulates AR gene transcription
(A) VCaP or LNCaP cells were treated with 0, 0.01, 0.1, 1, or 10 nM DHT for 4h, 8h, or 24h and AR mRNA was measured using qRTPCR. (B) VCaP cells were DHT stimulated for 24h and mRNA for PSA and ERG were measured by qRT-PCR. (C) VCaP cells were treated with cycloheximide (10 ng/mL) and DHT or vehicle, and AR mRNA was then measured by qRT-PCR after.0, 1, 4, 8, or 24h (mRNA expression was normalized to internal control 18S RNA in all the experiments). (D) VCaP cells were treated with 0, 0.1, 1, or 10 nM DHT and with 0, 10, or 40 μM bicalutamide for 24h and AR mRNA was measured by qRT-PCR. (E) Left panel - androgen starved VCaP cells were pretreated with DHT or vehicle for 2 hours followed by addition of actinomycin D (10 μM); right panel - VCaP cells growing in medium with DHT were switched to the same medium with or without DHT for 16 h, followed by addition of actinomycin D. AR mRNA was measured by qRT-PCR at the indicated times after actinomycin D addition. Levels at time 0 were normalized to 1 under both conditions in the left panel and under the DHT removal condition in the right panel. Dotted lines indicate 50% maximal level. (F) VCaP cells were treated with/out DHT for 4h. The DNA bound to RNA polymerase II or active RNA polymerase II (phospho-Ser5) was immunoprecipitated and measured by qPCR. Error bars in each experiment indicate standard deviation (SD).
Figure.3
Figure.3. Androgen stimulates AR recruitment to a site in intron 2 of the AR gene
(A) VCaP cells in steroid depleted medium (CSS mediom) were treated with 0, 1, or 10 nM DHT for 4h and the DNA bound to AR was measured by ChIP followed by qPCR. (B) The conserved region of ARBS2 (intron2) among 17 vertebrate sepcies was plotted using UCSC Genome Browser. (C) VCaP cells were pre-treated with/out 10 μM bicalutamide for 4h followed by treatment with 10 nM DHT for 4h. The DNA bound to AR was measured by ChIP followed by qPCR. (D) VCaP cells were treated for 4h with 0, 0.1, 1, or 10 nM DHT. AR binding to ARBS2 or the PSA enhancer ARE were measured by ChIP followed by qPCR. (E) VCaP cells were treated with/out 10 nM DHT for 4h and the DNA bound to FOXA1 was measured by ChIP and qPCR. Error bars in each experiment indicate SD. See also Figure S2 and see Table S1 for raw qPCR data for experiments shown.
Figure.4
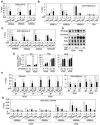
Figure.4. Androgen stimulates rapid demethylation of H3K4 in VCaP and VCaP-derived VCS2 cells
(A, B, C) VCaP cells were treated with/out DHT for 4h and the DNA bound to active RNA polymerase II, mono- or di-methylated H3K4 were measured ChIP and qPCR. (D,E) VCaP or VCS2 cells were treated with 0, 1, or 10 nM DHT for 24h and AR, PSA, ERG, and β-tubulin proteins were immunoblotted or mRNA were measured by ChIP followed by qRT-PCR (18S as internal control). (F,G) VCaP or VCS2 cells were treated with/out DHT for 4h and the DNA bound to AR, mono-methylated H3K4, Oct1, or GATA2 were measured by ChIP followed by qPCR. Error bars in each experiment indicate SD. See also Figure S3 and see Table S2 for raw qPCR data for experiments shown.
Figure.5
Figure.5. Androgen deprivation activates the ARBS2 site in LNCaP cells
(A) LNCaP cells were treated with/out 10nM DHT for 4h and the DNA bound to AR was immunoprecipitated and measured by qPCR. (B) LNCaP cells were treated with/out 10nM DHT for 4h and the DNA bound to AR, mono- or di-methylated H3K4 was immunoprecipitated and measured by qPCR. (C) LNCaP or LNCaP-CSS3 (adapted to steroind-depleted medium for >3w) were treated with 0, 1, or 10 nM DHT for 24h and AR mRNA was measured by qRT-PCR (18S as internal control). (D) LNCaP or LNCaP-CSS3 cells were treated with/out 10 nM DHT for 4h and the DNA bound to AR or mono-methylated H3K4 was measured by ChIP and qPCR. Error bars in each experiment indicate SD. See Table S3 for raw qPCR data for experiments shown.
Figure.6
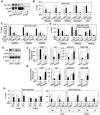
Figure.6. LSD1 is recruited to ARBS2 by the DHT liganded AR in vitro and in vivo
(A) VCaP cells were treated with/out 10 nM DHT for 24h and protein was then immunoprecipitated using anti-AR antibody or IgG control, followed by immunoblotting for LSD1 and AR. (B) VCS2 cells were treated with 0 or 10 nM DHT for 4h and the DNA bound to LSD1 was measured by ChIP and qPCR. (C) VCaP cells were grown in steroid-depleted medium supplemented with 10 nM DHT for 3d and then DHT was removed for 3d. The DNA bound to AR or LSD1 was measured by ChIP and qPCR. (D) The tissue of VCaP xenograft tumor (pre-castrated (−) or 4d post-castrated (+) mice) was formalin fixed, lysed and sonicated. The DNA bound to AR or LSD1 was immunoprecipitated and measured by qPCR. (E) VCaP cells were transfected with 20 nM LSD1 siRNA (Dharmacon) for 2d and then treated with/out DHT for 24h. AR, LSD1, and β-actin were immunoblotted. (F) VCaP cells transfected with LSD1 or control siRNA were stimulated with 10 nM DHT and LSD1, AR, AKR1C3, or HSD17B6 mRNA were measured using qRT-PCR. (G) VCaP cells were pre-treated with pargyline (2 mM) for 8h and then treated with/out DHT for 16h. LSD1, AR, AKR1C3, or HSD17B6 mRNA were measured using qRT-PCR (normalized to GAPDH as internal control). (H) VCaP cells were transfected with 20 nM LSD1 siRNA for 2d and then treated with/out 10 nM DHT for 4h. The DNA bound to mono- or di-methylated H3K4 was immunoprecipitated and measured by qPCR. Error bars in each experiment indicate SD. See also Figure S4 and see Table S4 for raw qPCR data for experiments shown.
Figure.7
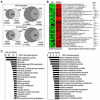
Figure.7. Identification of androgen repressed genes in VCaP cells and xenografts
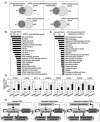
(A) VCaP or VCS2 cells were treated with/out 10 nM DHT for 24h and analyzed on Affymetrix U133A microarrays. The numbers of DHT-repressed genes or DHT-induced genes in VCaP and VCS2 cells and their overlaps are shown. (B) VCaP xenografts were established and biopsied at three stages: androgen-dependent tumor (AD), 4d post-castration (CS), and castration-resistant relapsed tumor (CRPC). mRNA were extracted from the biopsies of tumors of AD or CRPC stages and analyzed on Agilient microarrays. The data was analyzed using SAM software (Significance Analysis of Microarrays). The top 30 genes with lowest q-value are shown, with black arrows indicating DHT-repressed genes. (C) GO term analysis of DHT-repressed genes (left panel) versus androgen-induced genes (right panel). See also Figure S5 and Table S5.
Figure.8
Figure.8. Expression of androgen repressed genes is increased in human CRPC samples
(A) Affymetrix microarray expression data showing overlaps between androgen repressed/induced genes and the expression of 1490 genes that were increased and 626 genes that were decreased (p<0.001 and fold-change >1.5) in 34 CRPC bone marrow metastases compared with 27 primary tumors prior to any hormonal therapy. (B) GO term analysis of the group of 1490 CRPC-overexpressed genes and (C) 53 AR-repressed genes that were overexpressed in CRPC. (D) VCaP cells were pre-treated with pargyline (2 mM) for 8h and then treated with/out DHT for 16h. OPKR1, THBS1, BCL11A, STXBP6, MCM2, MCM4, MCM6, or MCM7 mRNA were measured using qRT-PCR (normalized to GAPDH as internal control). Error bars in each experiment indicate SD. (E) Graphical summary showing divergent effects of androgen deprivation on expression of AR stimulated genes, which are decreased, versus AR repressed genes (including the AR gene), which are increased. In castration resistant PCa, mechanisms including further increases in intratumoral androgen synthesis result in partial restoration of AR transcriptional activation function on genes mediating lipid and protein biosynthesis, but do not restore AR repressor function on the AR gene, or on genes mediating androgen synthesis, DNA synthesis and cell cycle progression. See also Figure S6 and Table S6.

Similar articles

Cited by

References

    1. Bauman DR, Steckelbroeck S, Williams MV, Peehl DM, Penning TM. Identification of the major oxidative 3alpha-hydroxysteroid dehydrogenase in human prostate that converts 5alpha-androstane-3alpha, 17beta-diol to 5alpha-dihydrotestosterone: a potential therapeutic target for androgen-dependent disease. Mol. Endocrinol. 2006;20:444–458. - PubMed
    1. Blok LJ, Themmen AP, Peters AH, Trapman J, Baarends WM, Hoogerbrugge JW, Grootegoed JA. Transcriptional regulation of androgen receptor gene expression in Sertoli cells and other cell types. Mol. Cell Endocrinol. 1992;88:153–164. - PubMed
    1. Cai C, Wang H, Xu Y, Chen S, Balk SP. Reactivation of androgen receptor-regulated TMPRSS2:ERG gene expression in castration-resistant prostate cancer. Cancer Res. 2009;69:6027–6032. - PMC - PubMed
    1. Chen CD, Welsbie DS, Tran C, Baek SH, Chen R, Vessella R, Rosenfeld MG, Sawyers CL. Molecular determinants of resistance to antiandrogen therapy. Nat. Med. 2004;10:33–39. - PubMed
    1. Cheng S, Brzostek S, Lee SR, Hollenberg AN, Balk SP. Inhibition of the dihydrotestosterone-activated androgen receptor by nuclear receptor corepressor. Mol. Endocrinol. 2002;16:1492–1501. - PubMed

Publication types

Associated data