Compaction of chromatin by diverse Polycomb group proteins requires localized regions of high charge
- PMID: 22012622
- PMCID: PMC3205590
- DOI: 10.1101/gad.17288211
Compaction of chromatin by diverse Polycomb group proteins requires localized regions of high charge
Abstract
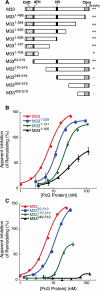
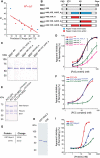
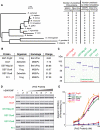
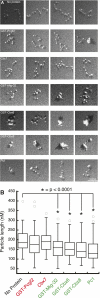
Polycomb group (PcG) proteins are required for the epigenetic maintenance of developmental genes in a silent state. Proteins in the Polycomb-repressive complex 1 (PRC1) class of the PcG are conserved from flies to humans and inhibit transcription. One hypothesis for PRC1 mechanism is that it compacts chromatin, based in part on electron microscopy experiments demonstrating that Drosophila PRC1 compacts nucleosomal arrays. We show that this function is conserved between Drosophila and mouse PRC1 complexes and requires a region with an overrepresentation of basic amino acids. While the active region is found in the Posterior Sex Combs (PSC) subunit in Drosophila, it is unexpectedly found in a different PRC1 subunit, a Polycomb homolog called M33, in mice. We provide experimental support for the general importance of a charged region by predicting the compacting capability of PcG proteins from species other than Drosophila and mice and by testing several of these proteins using solution assays and microscopy. We infer that the ability of PcG proteins to compact chromatin in vitro can be predicted by the presence of domains of high positive charge and that PRC1 components from a variety of species conserve this highly charged region. This supports the hypothesis that compaction is a key aspect of PcG function.
Figures


Similar articles
-
Functional dissection of Polycomb repressive complex 1 reveals the importance of a charged domain.Cold Spring Harb Symp Quant Biol. 2010;75:61-70. doi: 10.1101/sqb.2010.75.056. Epub 2011 Apr 18. Cold Spring Harb Symp Quant Biol. 2010. PMID: 21502414
-
A core subunit of Polycomb repressive complex 1 is broadly conserved in function but not primary sequence.Proc Natl Acad Sci U S A. 2012 May 1;109(18):E1063-71. doi: 10.1073/pnas.1118678109. Epub 2012 Apr 18. Proc Natl Acad Sci U S A. 2012. PMID: 22517748 Free PMC article.
-
Stabilization of chromatin structure by PRC1, a Polycomb complex.Cell. 1999 Jul 9;98(1):37-46. doi: 10.1016/S0092-8674(00)80604-2. Cell. 1999. PMID: 10412979
-
Molecular architecture of polycomb repressive complexes.Biochem Soc Trans. 2017 Feb 8;45(1):193-205. doi: 10.1042/BST20160173. Biochem Soc Trans. 2017. PMID: 28202673 Free PMC article. Review.
-
[Polycomb group protein complexes].Yi Chuan. 2009 Oct;31(10):977-81. doi: 10.3724/sp.j.1005.2009.00977. Yi Chuan. 2009. PMID: 19840918 Review. Chinese.
Cited by
-
Decoding histone ubiquitylation.Front Cell Dev Biol. 2022 Aug 29;10:968398. doi: 10.3389/fcell.2022.968398. eCollection 2022. Front Cell Dev Biol. 2022. PMID: 36105353 Free PMC article. Review.
-
Distinct roles for CKM-Mediator in controlling Polycomb-dependent chromosomal interactions and priming genes for induction.Nat Struct Mol Biol. 2022 Oct;29(10):1000-1010. doi: 10.1038/s41594-022-00840-5. Epub 2022 Oct 11. Nat Struct Mol Biol. 2022. PMID: 36220895 Free PMC article.
-
Architectural RNA in chromatin organization.Biochem Soc Trans. 2020 Oct 30;48(5):1967-1978. doi: 10.1042/BST20191226. Biochem Soc Trans. 2020. PMID: 32897323 Free PMC article. Review.
-
Roles of Polycomb Complexes in the Reconstruction of 3D Genome Architecture during Preimplantation Embryonic Development.Genes (Basel). 2022 Dec 16;13(12):2382. doi: 10.3390/genes13122382. Genes (Basel). 2022. PMID: 36553649 Free PMC article. Review.
-
Chromatin folding and nuclear architecture: PRC1 function in 3D.Curr Opin Genet Dev. 2019 Apr;55:82-90. doi: 10.1016/j.gde.2019.06.006. Epub 2019 Jul 16. Curr Opin Genet Dev. 2019. PMID: 31323466 Free PMC article. Review.
References
-
- Agianian B, Leonard K, Bonte E, Van der Zandt H, Becker PB, Tucker PA 1999. The glutamine-rich domain of the Drosophila GAGA factor is necessary for amyloid fibre formation in vitro, but not for chromatin remodelling. J Mol Biol 285: 527–544 - PubMed
-
- Alkema MJ, Bronk M, Verhoeven E, Otte A, van 't Veer LJ, Berns A, van Lohuizen M 1997. Identification of Bmi1-interacting proteins as constituents of a multimeric mammalian polycomb complex. Genes Dev 11: 226–240 - PubMed
-
- Boyer LA, Plath K, Zeitlinger J, Brambrink T, Medeiros LA, Lee TI, Levine SS, Wernig M, Tajonar A, Ray MK, et al. 2006. Polycomb complexes repress developmental regulators in murine embryonic stem cells. Nature 441: 349–353 - PubMed
Publication types
MeSH terms
Substances
Grants and funding
LinkOut - more resources
Full Text Sources
Molecular Biology Databases
Research Materials
