. 2011 Oct 15;25(20):2147-57.
doi: 10.1101/gad.17546311.

Oncogenic ETS proteins mimic activated RAS/MAPK signaling in prostate cells

Affiliations

Oncogenic ETS proteins mimic activated RAS/MAPK signaling in prostate cells

Peter C Hollenhorst et al. Genes Dev. .

Abstract

The aberrant expression of an oncogenic ETS transcription factor is implicated in the progression of the majority of prostate cancers, 40% of melanomas, and most cases of gastrointestinal stromal tumor and Ewing's sarcoma. Chromosomal rearrangements in prostate cancer result in overexpression of any one of four ETS transcription factors. How these four oncogenic ETS genes differ from the numerous other ETS genes expressed in normal prostate and contribute to tumor progression is not understood. We report that these oncogenic ETS proteins, but not other ETS factors, enhance prostate cell migration. Genome-wide binding analysis matched this specific biological function to occupancy of a unique set of genomic sites highlighted by the presence of ETS- and AP-1-binding sequences. ETS/AP-1-binding sequences are prototypical RAS-responsive elements, but oncogenic ETS proteins activated a RAS/MAPK transcriptional program in the absence of MAPK activation. Thus, overexpression of oncogenic ETS proteins can replace RAS/MAPK pathway activation in prostate cells. The genomic description of this ETS/AP-1-regulated, RAS-responsive, gene expression program provides a resource for understanding the role of these ETS factors in both an oncogenic setting and the developmental processes where these genes normally function.


Figures

Figure 1.
Figure 1.
A subset of ETS proteins can increase prostate cell migration. (A) A phylogram tree of human ETS domain sequences identifies subfamilies of one to three members each. ERG and PEA3 subfamilies are labeled. ETS family members expressed in normal prostate (>10 mRNA copies per cell) or overexpressed in prostate cancer, melanoma, or GIST are indicated. Also indicated are family members involved in EWS-ETS fusions in Ewing's sarcoma. (B) A protein immunoblot with anti-Flag antibody of whole-cell extracts from RWPE-1 cells expressing the indicated ETS gene or empty vector from an integrated retroviral vector. Molecular weight markers (kilodaltons) are shown on the left. Predicted molecular weights, including Flag, are ETV4, 57 kDa; SPDEF, 40 kDa; ETV5, 61 kDa; FLI1, 54 kDa; ERG, 57 kDa; FEV, 28 kDa; ETS2, 56 kDa; and ETV1, 58 kDa. Higher apparent molecular weights are consistent with previous reports (Wu and Janknecht 2002; Baert et al. 2007; Hollenhorst et al. 2011b). (C) RWPE-1 cells expressing the indicated ETS gene were cultured in a Boyden chamber with 8-μm pores in medium lacking growth supplements and allowed to migrate toward medium containing supplements. Cells that migrated out of the chamber were stained and a representative experiment is shown. (D) Migrating cells from C were counted and are reported relative to the number of migrating empty vector RWPE-1 cells. Cell number is the mean and SEM of four biological replicates, each consisting of the mean of two technical replicates. Genes found in chromosomal translocations in prostate cancer are marked.
Figure 2.
Figure 2.
Oncogenic ETS proteins occupy a common set of genomic regions. Diagrams illustrate the number of bound regions identified by ChIP-seq for each ETS protein. Bound regions were considered overlapping if any genomic coordinate was shared. (A) Overlaps from RWPE-1 ChIP-seq. ETS1 and GABPA ChIP-assayed endogenous proteins. ETV1 and ERG ChIP-assayed retrovirally expressed Flag-tagged proteins. (B) Overlaps between endogenous ETV4 in PC3 cells and ETS proteins in RWPE-1 cells from A. (C) Overlaps between ETV4 in PC3 cells, and Flag-ETV1 or Flag-ERG in RWPE-1 cells. Numbers in parentheses represent random predictions reported as the mean overlap in 100 iterations of randomly generated size- and GC content-matched genomic regions. Note that a smaller overlap between PC3 and RWPE-1 cell results is likely due to cell line differences. (D) Fraction of genes either up (542 genes with a mean expression increase greater than twofold), down (508 genes with a mean expression decrease greater than twofold), or unchanged in an ETV4 shRNA knockdown in PC3 cells (Hollenhorst et al. 2011b) that are nearest (distance to TSS) to an ETV4-bound region.
Figure 3.
Figure 3.
Genomic regions occupied by oncogenic ETS proteins have similar sequence motifs. (A) Regions occupied by the indicated ETS proteins were searched for overrepresented sequence motifs by MEME. The most enriched motifs are shown in logo form, where letter height corresponds to frequency. The E, or expect-value returned by MEME, is shown below each sequence. (B) Representative motifs from the 97 regions occupied commonly by ERG, ETV1, and ETV4 are shown. The percentage of these regions with the indicated motif is shown (Bound). “Random” indicates the percentage of an equally sized set of randomly selected genomic regions containing the same motif. (C) Spacing of sequence motifs found in regions occupied by ERG. The distance from all AGGAA sequences in regions bound by ERG to the nearest TGANTCA sequence was recorded, and the frequency of distances between −150 and +150 was plotted as a histogram. Distance was counted from the first nucleotide of each sequence. The most frequent position was +6, corresponding to the sequence AGGAANTGANTCA.
Figure 4.
Figure 4.
AP-1 and oncogenic ETS proteins co-occupy genomic regions, including the PLAU enhancers. (A) JUND-bound regions determined by ChIP-seq of endogenous proteins in PC3 cells are overlapped with ETS-bound regions in either PC3 cells (ETV4) or RWPE-1 cells (ERG, ETV1, ETS1, and GABPA). The random prediction is shown in parentheses as in Figure 2C. (B) ChIP-seq binding peaks are displayed in a 30-kb region of the human genome surrounding the PLAU gene (hg18, chr10:75,329,500–75,359,500) using the Integrated Genome Browser (http://igb.bioviz.org). PLAU is transcribed from left to right, and C10orf55 is transcribed from right to left. The Y-axis graphs log-transformed P-values based on ChIP-seq with the indicated antibody and cell line. Each track is shown in the same scale (0–150). An arrow marks the previously mapped PLAU enhancer at −2 kb. (C) PEA3 subfamily members, but not other ETS proteins, activate PLAU in RWPE-1 cells in normal growth medium. PLAU gene expression in RWPE-1 cells overexpressing the indicated ETS proteins was measured by qRT–PCR, normalized to the mean of control transcript 18s rRNA, and reported on a log scale relative to levels in cells expressing empty vector control (shown in lane 1). Results are the mean and SEM of three independent replicates.
Figure 5.
Figure 5.
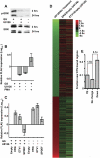
ERG and ETV1 activated a RAS/MAPK gene expression program in the absence of ERK activation. (A) Immunoblots identified protein levels in RWPE-1 whole-cell extracts using either an antibody to Y-204 phosphorylated ERK (p-ERK) or an anti-ERK antibody as indicated. Cells were cultured in the presence or absence of 10 μM U0126 or growth supplements (GS; EGF and bovine pituitary extract) for the time indicated. (B) PLAU gene expression was measured as described in Figure 4C from RWPE-1 cells grown in the presence or absence of the indicated treatments for 6 h. Results are reported relative to expression in normal growth medium (shown in lane 1) and are the mean and SEM of two independent replicates. (C) PLAU expression measured as in B from RWPE-1 cells overexpressing the indicated ETS protein and treated as indicated. Data are reported relative to expression in cells with an empty vector, not overexpressing an ETS protein (Empty). Results are the mean and SEM of four independent replicates. (D) A heat map shows mean gene expression changes in four replicates each of three microarray experiments. Genes displayed are those with a >1.7-fold change and P-value <0.001 in empty vector RWPE-1 cells treated with U0126 compared with untreated, empty vector RWPE-1 cells. Genes are rank-ordered from most down-regulated by U0126 to most up-regulated by U0126 (shown in lane 1). Gene expression changes in cells overexpressing ERG or ETV1 in the presence of U0126 compared with empty vector (Empty) cells in the presence of U0126 are shown in lanes 2 and 3, respectively. Red indicates up-regulated genes and green indicates down-regulated genes. (E) The fraction of genes in the indicated categories that have neighboring ERG- and ETV1-bound regions. Up and down categories include genes that increase or decrease expression, respectively, when U0126 is added to empty vector RWPE-1 cells as shown in lane 1 in D. Unchanged refers to all remaining genes. A neighboring gene is that with the closest TSS to a bound region. Fold enrichment over unchanged genes is shown above.
Figure 6.
Figure 6.
A model uses PLAU to represent the regulation of ETS/AP-1-regulated, RAS/MAPK target genes by ETS transcription factors. An unidentified endogenous ETS protein (ETS?) binds ETS/AP-1 sequence elements, but only activates gene expression when the RAS/MAPK pathway is active. The oncogenic ETS proteins ERG and ETV1 can activate expression when the RAS/MAPK pathway is off. ETV1 can superactivate when the RAS/MAPK pathway is on. SPDEF attenuates RAS/MAPK-mediated transcriptional activation.

Similar articles

Cited by

References

    1. Baert JL, Beaudoin C, Monte D, Degerny C, Mauen S, de Launoit Y 2007. The 26S proteasome system degrades the ERM transcription factor and regulates its transcription-enhancing activity. Oncogene 26: 415–424 - PubMed
    1. Bailey TL, Elkan C 1994. Fitting a mixture model by expectation maximization to discover motifs in biopolymers. Proc Int Conf Intell Syst Mol Biol 2: 28–36 - PubMed
    1. Bello D, Webber MM, Kleinman HK, Wartinger DD, Rhim JS 1997. Androgen responsive adult human prostatic epithelial cell lines immortalized by human papillomavirus 18. Carcinogenesis 18: 1215–1223 - PubMed
    1. Bonaccorsi L, Nesi G, Nuti F, Paglierani M, Krausz C, Masieri L, Serni S, Proietti-Pannunzi L, Fang Y, Jhanwar SC, et al. 2009. Persistence of expression of the TMPRSS2:ERG fusion gene after pre-surgery androgen ablation may be associated with early prostate specific antigen relapse of prostate cancer: preliminary results. J Endocrinol Invest 32: 590–596 - PubMed
    1. Bos JL 1989. ras oncogenes in human cancer: a review. Cancer Res 49: 4682–4689 - PubMed

Publication types

Substances