

An assessment of substitution scores for protein profile-profile comparison
- PMID: 21998158
- PMCID: PMC3232366
- DOI: 10.1093/bioinformatics/btr565
An assessment of substitution scores for protein profile-profile comparison
Abstract
Motivation: Pairwise protein sequence alignments are generally evaluated using scores defined as the sum of substitution scores for aligning amino acids to one another, and gap scores for aligning runs of amino acids in one sequence to null characters inserted into the other. Protein profiles may be abstracted from multiple alignments of protein sequences, and substitution and gap scores have been generalized to the alignment of such profiles either to single sequences or to other profiles. Although there is widespread agreement on the general form substitution scores should take for profile-sequence alignment, little consensus has been reached on how best to construct profile-profile substitution scores, and a large number of these scoring systems have been proposed. Here, we assess a variety of such substitution scores. For this evaluation, given a gold standard set of multiple alignments, we calculate the probability that a profile column yields a higher substitution score when aligned to a related than to an unrelated column. We also generalize this measure to sets of two or three adjacent columns. This simple approach has the advantages that it does not depend primarily upon the gold-standard alignment columns with the weakest empirical support, and that it does not need to fit gap and offset costs for use with each substitution score studied.
Results: A simple symmetrization of mean profile-sequence scores usually performed the best. These were followed closely by several specific scoring systems constructed using a variety of rationales.
Contact: altschul@ncbi.nlm.nih.gov
Supplementary information: Supplementary data are available at Bioinformatics online.
Figures
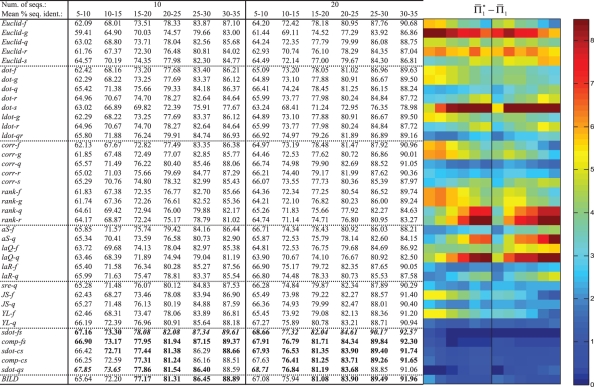
 on 2400 weighted profile pairs for each column. The color panel shows the difference between the maximum value in each column,
  , and individual values of
  . Some differences exceed the upper limit of the color scale.
Similar articles
-
The construction and use of log-odds substitution scores for multiple sequence alignment.PLoS Comput Biol. 2010 Jul 15;6(7):e1000852. doi: 10.1371/journal.pcbi.1000852. PLoS Comput Biol. 2010. PMID: 20657661 Free PMC article.
-
Scoring profile-to-profile sequence alignments.Protein Sci. 2004 Jun;13(6):1612-26. doi: 10.1110/ps.03601504. Protein Sci. 2004. PMID: 15152092 Free PMC article.
-
Log-odds sequence logos.Bioinformatics. 2015 Feb 1;31(3):324-31. doi: 10.1093/bioinformatics/btu634. Epub 2014 Oct 6. Bioinformatics. 2015. PMID: 25294922 Free PMC article.
-
A comparison of scoring functions for protein sequence profile alignment.Bioinformatics. 2004 May 22;20(8):1301-8. doi: 10.1093/bioinformatics/bth090. Epub 2004 Feb 12. Bioinformatics. 2004. PMID: 14962936
-
Robust sequence alignment using evolutionary rates coupled with an amino acid substitution matrix.BMC Bioinformatics. 2015 Aug 14;16:255. doi: 10.1186/s12859-015-0688-8. BMC Bioinformatics. 2015. PMID: 26269100 Free PMC article.
Cited by
-
ReformAlign: improved multiple sequence alignments using a profile-based meta-alignment approach.BMC Bioinformatics. 2014 Aug 7;15(1):265. doi: 10.1186/1471-2105-15-265. BMC Bioinformatics. 2014. PMID: 25099134 Free PMC article.
-
BioSeq-BLM: a platform for analyzing DNA, RNA and protein sequences based on biological language models.Nucleic Acids Res. 2021 Dec 16;49(22):e129. doi: 10.1093/nar/gkab829. Nucleic Acids Res. 2021. PMID: 34581805 Free PMC article.
-
Dirichlet mixtures, the Dirichlet process, and the structure of protein space.J Comput Biol. 2013 Jan;20(1):1-18. doi: 10.1089/cmb.2012.0244. J Comput Biol. 2013. PMID: 23294268 Free PMC article.
References
-
- Altschul S.F. Gap costs for multiple sequence alignment. J. Theor. Biol. 1989;138:297–309. - PubMed
-
- Altschul S.F., Lipman D.J. Trees, stars, and multiple biological sequence alignment. SIAM J. Appl. Math. 1989;49:197–209.
-
- Altschul S.F., et al. Weights for data related by a tree. J. Mol. Biol. 1989;207:647–653. - PubMed
Publication types
MeSH terms
Substances
Grants and funding
LinkOut - more resources
Full Text Sources
Miscellaneous
