. 2011 Sep;13(9):841-53.
doi: 10.1593/neo.11698.

Hypomethylation of the hsa-miR-191 locus causes high expression of hsa-mir-191 and promotes the epithelial-to-mesenchymal transition in hepatocellular carcinoma

Affiliations

Hypomethylation of the hsa-miR-191 locus causes high expression of hsa-mir-191 and promotes the epithelial-to-mesenchymal transition in hepatocellular carcinoma

Yinghua He et al. Neoplasia. 2011 Sep.

Abstract

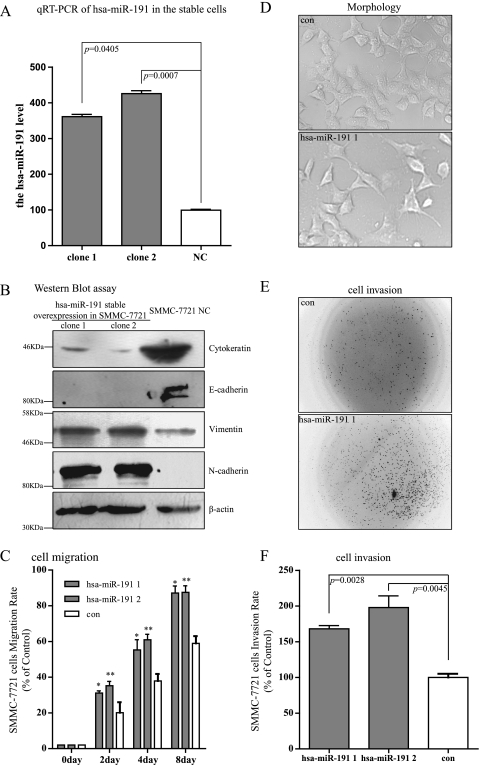
hsa-miR-191 is highly expressed in hepatocellular carcinoma (HCC), but the factors regulating this elevated expression are unknown. This study aimed to investigate the epigenetic mechanisms of increased hsa-miR-191 expression by analyzing the relationship between the DNA methylation status of hsa-miR-191 and miR-191 expression. Methylation-specific polymerase chain reaction (PCR), bisulfite sequencing PCR, Northern blot, and quantitative real-time PCR were performed to examine hsa-miR-191 methylation and expression levels. Western blot, transwell, and scratch assays were performed to examine the function and molecular mechanisms of hsa-miR-191. Approximately 58.9% of hsa-miR-191 expression was higher in HCC tissues than in adjacent noncancerous tissues; this high expression was associated with poor prognosis. The hypomethylation observed in some HCC cell lines and HCC tissues was correlated with the hsa-miR-191 expression level. This correlation was validated by treatment with the 5-aza-DAC demethylation agent. The level of hypomethylation was 63.0% in 73 clinical HCC tissue samples and was associated with increased (2.1-fold) hsa-miR-191 expression. The elevated expression of hsa-miR-191 in the SMMC-771 HCC cell line induced the cells to transition into mesenchymal-like cells; they exhibited characteristics such as loss of adhesion, down-regulation of epithelial cell markers, up-regulation of mesenchymal cell markers, and increased cell migration and invasion. Inhibiting hsa-miR-191 expression in the SMMC-7721 cell line reversed this process (as assessed by cell morphology and cell markers). Furthermore, hsa-miR-191 probably exerted its function by directly targeting TIMP metallopeptidase inhibitor 3 and inhibiting TIMP3 protein expression. Our results suggest that hsa-miR-191 locus hypomethylation causes an increase in hsa-miR-191 expression in HCC clinical tissues and that this expression induces HCC cells to transition into mesenchymal-like cells.


Figures

Figure 1
Figure 1
MicroRNAs are regulated by DNA methylation. (A) Flowchart for the identification of miRNAs that may be regulated by DNA methylation in normal liver tissue and HCC cell lines. The DNA and miRNA samples from normal liver tissue and HCC cells were collected to construct DNA methylome and miRNA expression profiles. To compare the sites of miRNA and CpG islands on the chromosome, a set of 135 miRNAs was first used for analysis. Second, by eliminating the miRNAs that were not expressed in normal tissues or HCC cell lines (based on our miRNA expression profile), we narrowed this set of miRNAs down to 31 miRNAs. Third, we analyzed the differences in methylation signals from these 31 miRNAs between normal tissues and HCC cell lines, further narrowing the set of miRNAs to 17. (B) Differences in DNA methylation between normal tissues and the HCC cell lines in the DNA methylome of 17 miRNAs. (C) Expression profiles of 17 miRNAs in HCC cell lines compared to normal liver tissue. The value shown here is the log (miRNA expression in the HCC cell line/normal liver tissue); data are from miRNA expression profiles.
Figure 2
Figure 2
The high expression level of miR-191 in HCC tissues is associated with a poor prognosis. (A) We analyzed the expression levels of miRNAs in 73 pairs of HCC tissues and found an increase of 37.2% in the expression level of miR-191 in HCC tissues when compared with adjacent noncancerous tissues, P = .0066 (paired t test). miR-191 expression is upregulated in 58.9% of these 73 pairs of tissues. The expression levels of miR-191 are higher in both HCC tissues and adjacent noncancerous tissues compared with normal tissues. (B) Overexpression of miR-191 is associated with a poor prognosis. miR-191 expression in HCC tissues is listed from lowest to highest; the 35 HCC tissues with the lowest miR-191 expression levels were placed into the low-expression group, whereas the 35 HCC tissues with the highest miR-191 expression levels were placed into the high-expression group. (C) The miR-191 precursors, DALRD3 and NDUFAF3, a cis-antisense gene pair, tend to be coexpressed.
Figure 3
Figure 3
Some cells show hypomethylation of the hsa-miR-191 locus and high expression of hsa-miR-191. (A) The miRNA hsa-miR-191 is located in the promoter region of DALRD3 on chromosome 3, where there is also a CpG-rich sequence and a DNA methylation signal. In addition, BSP and MSP regions are located in the first intron of DALRD3, downstream of hsa-miR-191. (B) The hypomethylation of hsa-miR-191 in HCC cells is shown by a BSP-based assay. The levels of DNA methylation are 92.9%, 82.9%, 84.3%, 12.9%, 85.7%, 92.9%, and 18.6% in normal liver tissue, SMMC-7721 cells, QGY-7703, PLC/PRF/5, BEL-7402, HepG2, and Hep3B cells, respectively. (C) hsa-miR-191 expression levels in normal liver tissue and HCC cell lines by Northern blot. The quantification of hsa-miR-191 expression is shown based on the results of a Northern blot assay. The expression level of hsa-miR-191 was normalized to that of U6. The expression levels were upregulated 4.1-fold (P < .0001) and 3.21-fold (P < .0001) in PLC/PRF/5 and Hep3B cell lines, respectively, compared with the levels of normal liver tissue. (D, E) mRNA levels of DALRD3 (D) and NDUFAF3 (E) in normal liver tissue and HCC cell lines were analyzed by qRT-PCR. These two genes were highly expressed in PLC/PRF/5 and Hep3B cell lines. These results were analyzed by a Student's t test.
Figure 4
Figure 4
Alterations in DNA methylation status and hsa-miR-191 expression in BEL-7402 cells that were treated with 5′-aza-CdR. (A) The hsa-miR-191 locus becomes hypomethylated after 5′-aza-CdR treatment. In BEL-7402 cells, the rate of DNA methylation before treatment was 84.3% and decreased to 71%, 51%, 70%, and 27% after 1, 2, 3, and 5 days of treatment, respectively. (B) The levels of miR-191 expression (B1, B2) and the mRNA levels of DALRD3/NDUFAF3 (B3, B4) are upregulated after treatment with 5′-aza-CdR. The expression level of miR-191 was detected by Northern blot and qRT-PCR, and the mRNA levels of DALRD3/NDUFAF3 were detected by qRT-PCR.
Figure 5
Figure 5
The hsa-miR-191 locus is hypomethylated and highly expressed in HCC tissues. (A) An MSP-based assay was used to detect hsa-miR-191 locus methylation in 11 pairs of clinical HCC tissues. No methylation of the hsa-miR-191 locus was observed in 11 HCC tissues. (B) hsa-miR-191 is highly expressed in the 11 HCC tissues that were not methylated. (C) Validation of the MSP-based assay by the BSP-based assay. Case nos. 257 and 202 were chosen for the assay. Hypermethylation was observed in adjacent noncancerous tissues, and hypomethylation was observed in HCC tissues. (D) An MSP-based assay was used to detect methylation of the hsa-miR-191 locus in 73 clinical HCC tissues. On the basis of these results, the clinical tissues were placed into two categories, a methylated group and a nonmethylated group. The expression level of hsa-miR-191 in the nonmethylated group was higher than the expression level in the methylated group (2.1-fold difference). The rate of hypomethylation was 63.0%. The results were analyzed by a Student's t test.
Figure 6
Figure 6
Overexpression of hsa-miR-191 induces SMMC-7721 cells to transition into mesenchymal-like cells. (A) Expression levels of hsa-miR-191 in the hsa-miR-191 stably overexpressing cell line, as detected by qRT-PCR. The expression levels of hsa-miR-191 were upregulated approximately four-fold in the two resultant clones. (B) Alterations in epithelial (cytokeratin and E-cadherin) and mesenchymal (vimentin and N-cadherin) marker expression in the stable hsa-miR-191-overexpressing cell lines compared with the control. The expression levels of the epithelial markers pan-cytokeratin and E-cadherin were sharply reduced. By contrast, the expression levels of the mesenchymal markers vimentin and N-cadherin were increased in the hsa-miR-191-overexpressing cell lines. (C) The overexpression of hsa-miR-191 leads to an increase in cell migration. As determined by the scratch assay, the hsa-miR-191-overexpressing cell lines reached 87% fusion 8 days after the scratch-induced wound compared with the control (stable overexpression of the empty vector; P = .0141 and P = .0045 in the stable hsa-miR-191-overexpressing cell lines 1 and 2, respectively). By contrast, the SMMC-7721 control cell line reached 59.0% fusion. (D) Morphology of the stable hsa-miR-191-overexpressing cell line compared with the morphology of the control cell line. The overexpressing cells have long, thin processes and reduced cell-to-cell contacts. (E and F) Overexpression of hsa-miR-191 increased cell invasion as determined by the transwell assay using a Matrigel-coated membrane. Cell invasion increased by 2.02-fold (P = .0028) and 1.72-fold (P = .0045) in the stable hsa-miR-191 overexpressing cell lines 1 and 2, respectively, compared with the control. Results were analyzed by a Student's t test.
Figure 7
Figure 7
Inhibition of hsa-miR-191 induces SMMC-7721 cells to transition into epithelial-like cells. (A) Expression levels of hsa-miR-191 in the SMMC-7721 cell line transfected with antagomiR to miR-191, as detected by qRT-PCR. Expression levels of hsa-miR-191 were downregulated (P = .0026, P = .0016, and P = .0006 in the SMMC-7721 cells transfected with antagomiR to miR-191 [40, 120, and 360 pmol, respectively] compared with their NC controls, Student's t test). (B) Alterations in epithelial (cytokeratin) and mesenchymal (vimentin) marker expression in the SMMC-7721 cells transfected with antagomiR-191 compared with the controls. The expression level of the pan-cytokeratin epithelial marker was increased. By contrast, the expression level of the mesenchymal marker vimentin was suppressed. (C) The morphology of the SMMC-7721 cells that were transfected with antagomiR to miR-191 is altered. The cell-to-cell contraction is increased in the SMMC-7721 cells that were transfected with antagomiR to miR-191 compared with the controls.
Figure 8
Figure 8
Analysis of hsa-miR-191 targets. (A) Flowchart of hsa-miR-191 target analysis. The target analysis is based on the miR-191 expression level in HCC cell lines (Figure 2), mRNA expression profile (our unpublished data), and target prediction in microRNA.org. Nine genes were chosen as putative miR-191 targets. (B) mRNA profiles of the nine target genes in the HCC cell lines. The value is the log (mRNA expression in HCC cell line/normal liver tissue) according to the mRNA expression profile. (C) TIMP3 has low expression in the HCC cell lines. TIMP3 has especially low expression in the PLC/PRF/5 and Hep3B cell lines. (D) Reduced firefly luciferase activity owing to hsa-miR-191 expression. SMMC-7721 was cotransfected with hsa-miR-191 mimics and a reporter construct that carried a miR-191 prediction target sequence in TIMP3; the activity of firefly luciferase was normalized to that of Renilla luciferase. Compared with the control, the activity of firefly luciferase was reduced by 50% when the level of hsa-miR-191 was increased to 10 pmol/well (96-well plate). (E) Reduction in TIMP3 protein levels in stable hsa-miR-191-overexpressing cell lines. Compared with the control, TIMP3 levels were reduced by 50% to 80% in both stable hsa-miR-191-overexpressing cell lines.

Similar articles

Cited by

References

    1. El-Serag HB, Rudolph KL. Hepatocellular carcinoma: epidemiology and molecular carcinogenesis. Gastroenterology. 2007;132:2557–2576. - PubMed
    1. Calvisi DF, Ladu S, Gorden A, Farina M, Lee JS, Conner EA, Schroeder I, Factor VM, Thorgeirsson SS. Mechanistic and prognostic significance of aberrant methylation in the molecular pathogenesis of human hepatocellular carcinoma. J Clin Invest. 2007;117:2713–2722. - PMC - PubMed
    1. Nomoto S, Kinoshita T, Kato K, Otani S, Kasuya H, Takeda S, Kanazumi N, Sugimoto H, Nakao A. Hypermethylation of multiple genes as clonal markers in multicentric hepatocellular carcinoma. Br J Cancer. 2007;97:1260–1265. - PMC - PubMed
    1. Morgan TR, Mandayam S, Jamal MM. Alcohol and hepatocellular carcinoma. Gastroenterology. 2004;127:S87–S96. - PubMed
    1. Bartel DP. MicroRNAs: genomics, biogenesis, mechanism, and function. Cell. 2004;116:281–297. - PubMed

Publication types

MeSH terms