. 2011 Nov;22(22):4380-9.
doi: 10.1091/mbc.E10-12-0936. Epub 2011 Sep 30.

The endocytic protein GRAF1 is directed to cell-matrix adhesion sites and regulates cell spreading

Affiliations

The endocytic protein GRAF1 is directed to cell-matrix adhesion sites and regulates cell spreading

Gary J Doherty et al. Mol Biol Cell. 2011 Nov.

Abstract

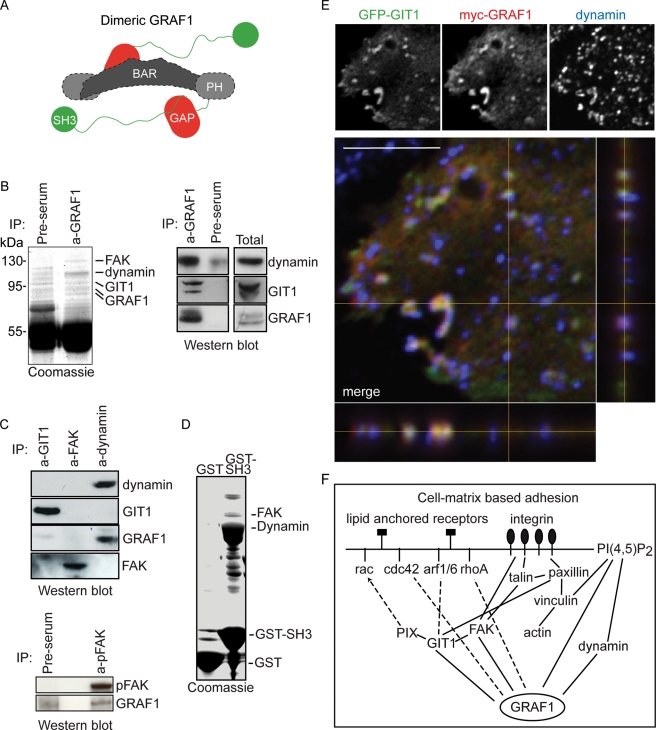
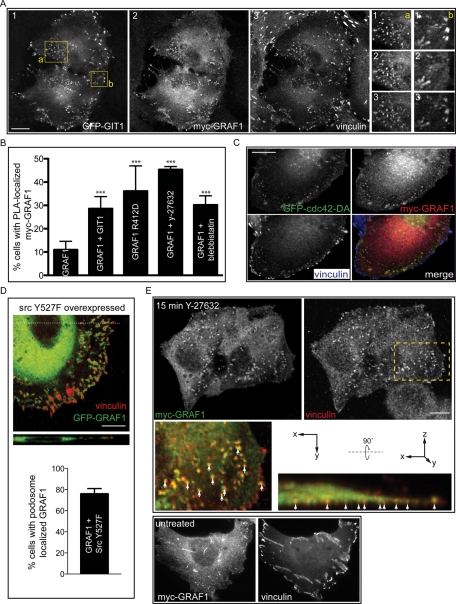
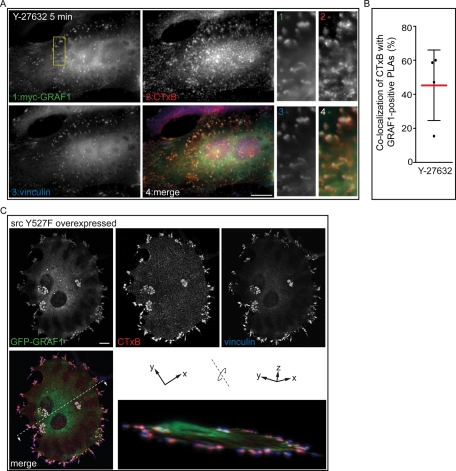
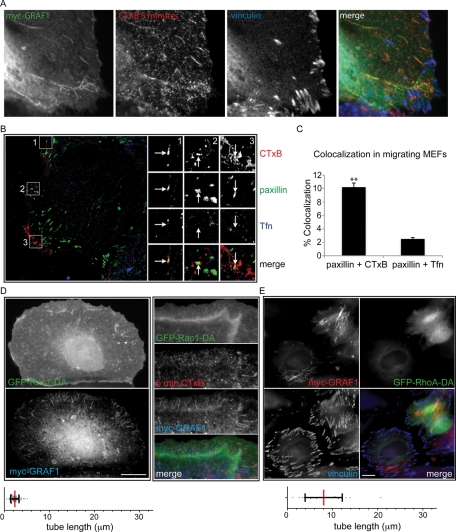
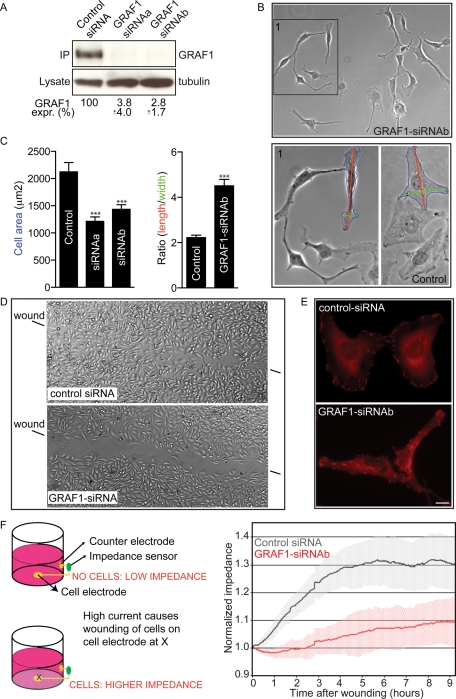
The rho GTPase-activating protein GTPase regulator associated with focal adhesion kinase-1 (GRAF1) remodels membranes into tubulovesicular clathrin-independent carriers (CLICs) mediating lipid-anchored receptor endocytosis. However, the cell biological functions of this highly prevalent endocytic pathway are unclear. In this article, we present biochemical and cell biological evidence that GRAF1 interacted with a network of endocytic and adhesion proteins and was found enriched at podosome-like adhesions and src-induced podosomes. We further demonstrate that these sites comprise microdomains of highly ordered lipid enriched in GRAF1 endocytic cargo. GRAF1 activity was upregulated in spreading cells and uptake via CLICs was concentrated at the leading edge of migrating cells. Depletion of GRAF1, which inhibits CLIC generation, resulted in profound defects in cell spreading and migration. We propose that GRAF1 remodels membrane microdomains at adhesion sites into endocytic carriers, facilitating membrane turnover during cell morphological changes.


Figures

FIGURE 1:
FIGURE 1:
GRAF1 interacts with proteins involved in membrane remodeling and cell adhesion. (A) Domain model of GRAF1. (B) Immunoprecipitation of GRAF1 from rat brain cytosol showing that GRAF1 interacts with dynamin, GIT1, and FAK as identified by mass spectrometry and confirmed by Western blotting with the indicated antibodies. (C) Immunoprecipitates of GIT1, FAK, dynamin, and pFAK from rat brain cytosol were analyzed by SDS–PAGE and immunoblotting with antibodies against the indicated proteins. (D) Coomassie-stained gel of pulldown experiments against brain lysates with beads bound to GST or GST-tagged GRAF1 SH3 domain (GST-SH3). Indicated proteins were identified by mass spectrometry. (E) Confocal micrograph of a HeLa cell expressing GFP-GIT1 and myc-GRAF1, costained for dynamin. Merged image shows section views (as indicated by yellow lines). Note that structures with all three proteins colocalizing are found at the basal surface, while dynamin is also found at the top surface. Scale bar: 5 μm. (F) Schematic representation of the GRAF1 interactome, showing the interactions that link cell adhesion, small G-protein regulation, and GRAF1-mediated membrane trafficking (Hildebrand et al., 1996; Zamir and Geiger, 2001a, 2001b; Hoefen and Berk, 2006; Lundmark et al., 2008). Dotted lines show interactions known to be directly activating (arrowheads) or inhibiting (no arrowheads) the active state of depicted small G protein.
FIGURE 2:
FIGURE 2:
GRAF1 is not a general component of focal adhesions but localizes to PLAs. (A) Fluorescence micrograph of HeLa cells coexpressing myc-tagged GRAF1 and GFP-tagged GIT1 and costained for myc and vinculin. Insets show magnifications of the areas indicated by yellow squares. (B) Bar graph showing the percentage of cells in which myc-GRAF1 or myc-GRAF1 R412D was found localized with vinculin in PLAs following the indicated treatments or overexpression of GFP-GIT1. Cells expressing myc-GRAF1 were treated with Y-27632, an inhibitor of rhoA kinase (5 min), or blebbistatin, an inhibitor of nonmuscle myosin II (10 min), and the number of cells where GRAF1 colocalized with vinculin was counted. Bars and error bars correspond to mean and SEM calculated from three independent experiments (n > 250; α = 0.05; two-tailed Fisher's exact test, ***, p < 0.001). (C) Fluorescence micrograph of cells coexpressing myc-tagged GRAF1 and GFP-cdc42-DA and costained for myc and vinculin. (D) Merged confocal micrograph of a cell expressing src Y527F and GFP-GRAF1 and costained for vinculin. Inset below shows three-dimensional view of the section indicated by the dotted line. Bar graph depicting the percentage of cells with untagged or GFP-tagged GRAF1 localized to vinculin-defined, src-induced podosomes. Bars and error bars correspond to mean and SEM calculated from six independent experiments, each including 30 cells. (E) Fluorescence micrographs of cells treated with the ROCK inhibitor Y-27632 for 15 min or untreated before fixation and staining for vinculin and overexpressed myc-GRAF1. Insets in the top panel show magnification and three-dimensional rotation of the area indicated in the vinculin panel. Arrows indicate basal structures in which GRAF1 and vinculin colocalize. Scale bars: 10 μm.
FIGURE 3:
FIGURE 3:
Adhesion reorganization results in clustering of CTxB at the cell surface in GRAF1-positive structures. (A) Fluorescence micrographs of myc-GRAF1–expressing HeLa cells incubated with Y-27632 together with CTxB-Alexa555 for 5 min as indicated before washing, fixation, and costaining for vinculin. Insets are magnifications of the area marked by a rectangle in panel 1. (B) Vinculin- and myc-GRAF1-positive PLA areas were selected from four cells from two different experiments, and the percent colocalization of CTxB was measured as described in the text. The mean is indicated by a red line and the error bars represent standard deviation (SD) above and below the mean. (C) Confocal micrograph of cell expressing src Y527F and GFP-GRAF1 and incubated together with CTxB-Alexa555 for 5 min before washing, fixation, and costaining for vinculin. The merged image is rotated to highlight the basal localization of GRAF1-positive structures. Scale bars; 10 μm.
FIGURE 4:
FIGURE 4:
Membrane remodeling by GRAF1 and uptake of CTxB are stimulated at the leading edge of migrating cells. (A) Fluorescence micrographs of myc-GRAF1–expressing HeLa cells incubated with CTxB-Alexa555 for 5 min before washing, fixation, and costaining for vinculin. (B) Confluent wild-type MEF monolayers were wounded by scratching, and cells were allowed to migrate into the wound for 4–6 h. CTxB-555 and Tfn-647 were then added to migrating cells for 2 min of uptake at 37°C. Cells were acid-stripped and fixed and were then labeled for endogenous paxillin. Arrows indicate colocalization between paxillin and CTxB but not Tfn. (C) Twenty-four cells across three independent experiments were treated as in (B), and the percentage of paxillin (green) pixels that colocalized with either CTxB (red) or Tfn (blue) pixels was calculated using Volocity version 3.0. Bars and error bars correspond to mean and SEM (n = 12–15; α = 0.05; Student's t test, **, p < 0.01). (D) Fluorescence micrographs of HeLa cells expressing myc-GRAF1 and DA rac1 (GFP-Rac-DA; left panels) and incubated with CTxB-Alexa555 for 5 min (right panels). The length of GRAF1 tubules was measured in fluorescence micrographs of seven different cells (n = 193) as described. The mean length is indicated by a red line and the error bars represent standard deviation (SD) above and below the mean. (E) Fluorescence micrographs of cells expressing myc-GRAF1 and DA rhoA (GFP-rhoA-DA) and costained for vinculin. GRAF1-positive tubules were found in 14.3 ± 3.7%, as determined from three independent experiments (n = 124; error values represent SEM). Length of GRAF1 tubules in μm was measured from nine different cells (n = 108) and depicted as in Figure 4D. Scale bars: 10 μm.
FIGURE 5:
FIGURE 5:
GRAF1 is necessary for cell spreading and migration. (A) Immunoprecipitation and immunodetection of GRAF1 from HeLa cells treated with either a control siRNA or siRNAs against GRAF1. Tubulin was detected in the cell lysates as an immunoprecipitation control. GRAF1 expression following siRNA treatment (GRAF1 expr. (%)) was quantified as described from three independent experiments. Values correspond to normalized means ±SD. (B) Micrographs of cells treated with either a control siRNA or siRNAb against GRAF1 for 72 h before fixation and imaging. Inset 1 (left panel) shows magnification of the marked square. Inset 1 (right panel) exemplifies cell area indicated in blue, and length and width indicated in red and green, respectively. (C) Bar graphs showing quantification of the cell area and length:width ratios, as described in the text, of cells treated with control siRNA or siRNAs against GRAF1, as in (B). In the left panel, bars and error bars correspond to mean and SEM calculated from five or six independent experiments (n = 50–60; α = 0.05; Student's t test, ***, p < 0.001). In the right panel, bars and error bars correspond to mean and SEM calculated from two independent experiments (n > 100; a α = 0.05; Student's t test, ***, p < 0.001). Length:width ratio was scored as the ratio between length (longest straight line within a cell (red line in (B)) and width (the broadest region perpendicular to the measured length (green line in (B)). (D) Micrograph showing the regrowth of control siRNA-treated and GRAF1 siRNA-treated cells into an induced wound in the cell monolayer. (E) Fluorescence micrograph of control cells and GRAF1-depleted cells stained for vinculin. (F) Principle of electrically induced and monitored wound-healing assay performed as described (left panel). Graph showing the recovery from electrical wound healing of a confluent HeLa cell layer. Cells were previously transfected with a control siRNA or GRAF1-siRNA, as indicated. An increase in impedance reflects the migration of surrounding healthy cells onto an electrode through which (at time zero) a high current has passed to irreversibly injure the cells on the electrode. Note the delay in wound healing observed in GRAF1-depleted cells and their slowed and incomplete recovery (even after 9 h), compared with control cells. Impedance values were normalized to postwounding nadirs, and the shaded areas surrounding each curve represent one SD above and below the mean values for each condition. Scale bars: 10 μm.

Similar articles

Cited by

References

    1. Baldassarre M, Pompeo A, Beznoussenko G, Castaldi C, Cortellino S, McNiven MA, Luini A, Buccione R. Dynamin participates in focal extracellular matrix degradation by invasive cells. Mol Biol Cell. 2003;14:1074–1084. - PMC - PubMed
    1. Block MR, Badowski C, Millon-Fremillon A, Bouvard D, Bouin AP, Faurobert E, Gerber-Scokaert D, Planus E, Albiges-Rizo C. Podosome-type adhesions and focal adhesions, so alike yet so different. Eur J Cell Biol. 2008;87:491–506. - PubMed
    1. Caswell PT, Vadrevu S, Norman JC. Integrins: masters and slaves of endocytic transport. Nat Rev Mol Cell Biol. 2009;10:843–853. - PubMed
    1. Chadda R, Howes MT, Plowman SJ, Hancock JF, Parton RG, Mayor S. Cholesterol-sensitive Cdc42 activation regulates actin polymerization for endocytosis via the GEEC pathway. Traffic. 2007;8:702–717. - PubMed
    1. Claing A, Perry SJ, Achiriloaie M, Walker JK, Albanesi JP, Lefkowitz RJ, Premont RT. Multiple endocytic pathways of G protein-coupled receptors delineated by GIT1 sensitivity. Proc Natl Acad Sci USA. 2000;97:1119–1124. - PMC - PubMed

Publication types