Absence of CNTNAP2 leads to epilepsy, neuronal migration abnormalities, and core autism-related deficits
- PMID: 21962519
- PMCID: PMC3390029
- DOI: 10.1016/j.cell.2011.08.040
Absence of CNTNAP2 leads to epilepsy, neuronal migration abnormalities, and core autism-related deficits
Abstract
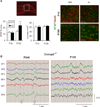
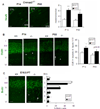
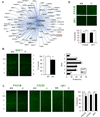
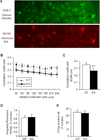
Although many genes predisposing to autism spectrum disorders (ASD) have been identified, the biological mechanism(s) remain unclear. Mouse models based on human disease-causing mutations provide the potential for understanding gene function and novel treatment development. Here, we characterize a mouse knockout of the Cntnap2 gene, which is strongly associated with ASD and allied neurodevelopmental disorders. Cntnap2(-/-) mice show deficits in the three core ASD behavioral domains, as well as hyperactivity and epileptic seizures, as have been reported in humans with CNTNAP2 mutations. Neuropathological and physiological analyses of these mice before the onset of seizures reveal neuronal migration abnormalities, reduced number of interneurons, and abnormal neuronal network activity. In addition, treatment with the FDA-approved drug risperidone ameliorates the targeted repetitive behaviors in the mutant mice. These data demonstrate a functional role for CNTNAP2 in brain development and provide a new tool for mechanistic and therapeutic research in ASD.
Copyright © 2011 Elsevier Inc. All rights reserved.
Figures


Comment in
-
Unweaving the autism spectrum.Cell. 2011 Sep 30;147(1):24-5. doi: 10.1016/j.cell.2011.09.017. Cell. 2011. PMID: 21962503
-
Neurodevelopmental disorders: Mice that mirror autism.Nat Rev Neurosci. 2011 Oct 20;12(11):615. doi: 10.1038/nrn3129. Nat Rev Neurosci. 2011. PMID: 22011675 No abstract available.
Similar articles
-
Homozygous Loss of Autism-Risk Gene CNTNAP2 Results in Reduced Local and Long-Range Prefrontal Functional Connectivity.Cereb Cortex. 2018 Apr 1;28(4):1141-1153. doi: 10.1093/cercor/bhx022. Cereb Cortex. 2018. PMID: 28184409
-
Transient CSF1R inhibition ameliorates behavioral deficits in Cntnap2 knockout and valproic acid-exposed mouse models of autism.J Neuroinflammation. 2024 Oct 18;21(1):262. doi: 10.1186/s12974-024-03259-5. J Neuroinflammation. 2024. PMID: 39425203 Free PMC article.
-
Loss of Cntnap2 in the Rat Causes Autism-Related Alterations in Social Interactions, Stereotypic Behavior, and Sensory Processing.Autism Res. 2020 Oct;13(10):1698-1717. doi: 10.1002/aur.2364. Epub 2020 Sep 11. Autism Res. 2020. PMID: 32918359
-
What does CNTNAP2 reveal about autism spectrum disorder?Trends Mol Med. 2012 Mar;18(3):156-63. doi: 10.1016/j.molmed.2012.01.003. Epub 2012 Feb 25. Trends Mol Med. 2012. PMID: 22365836 Free PMC article. Review.
-
Modeling of autism genetic variations in mice: focusing on synaptic and microcircuit dysfunctions.Dev Neurosci. 2012;34(2-3):88-100. doi: 10.1159/000336644. Epub 2012 May 8. Dev Neurosci. 2012. PMID: 22572629 Review.
Cited by
-
Epilepsy Characteristics in Neurodevelopmental Disorders: Research from Patient Cohorts and Animal Models Focusing on Autism Spectrum Disorder.Int J Mol Sci. 2022 Sep 16;23(18):10807. doi: 10.3390/ijms231810807. Int J Mol Sci. 2022. PMID: 36142719 Free PMC article. Review.
-
Clinical and Neurobiological Relevance of Current Animal Models of Autism Spectrum Disorders.Biomol Ther (Seoul). 2016 May 1;24(3):207-43. doi: 10.4062/biomolther.2016.061. Biomol Ther (Seoul). 2016. PMID: 27133257 Free PMC article. Review.
-
Mice with reduced NMDA receptor expression: more consistent with autism than schizophrenia?Genes Brain Behav. 2012 Aug;11(6):740-50. doi: 10.1111/j.1601-183X.2012.00816.x. Genes Brain Behav. 2012. PMID: 22726567 Free PMC article.
-
GABAB Receptor Agonist R-Baclofen Reverses Social Deficits and Reduces Repetitive Behavior in Two Mouse Models of Autism.Neuropsychopharmacology. 2015 Aug;40(9):2228-39. doi: 10.1038/npp.2015.66. Epub 2015 Mar 10. Neuropsychopharmacology. 2015. PMID: 25754761 Free PMC article.
-
Neuronal birth order identifies a dimorphic sensorineural map.J Neurosci. 2012 Feb 29;32(9):2976-87. doi: 10.1523/JNEUROSCI.5157-11.2012. J Neurosci. 2012. PMID: 22378871 Free PMC article.
References
-
- Albin RL, Young AB, Penney JB. The functional anatomy of basal ganglia disorders. Trends Neurosci. 1989;12:366–375. - PubMed
-
- Angevine JB, Sidman RL. Autoradiographic study of cell migration during histogenesis of cerebral cortex in the mouse. Nature. 1961;192:766–768. - PubMed
-
- American Psychiatric Association. Diagnostic and Statistical Manual of Mental Disorders. Washington, DC: 2000.
Publication types
MeSH terms
Substances
Grants and funding
LinkOut - more resources
Full Text Sources
Other Literature Sources
Molecular Biology Databases

