. 2011 Dec;85(23):12362-75.
doi: 10.1128/JVI.06059-11. Epub 2011 Sep 28.

Epstein-Barr virus BamHI W repeat number limits EBNA2/EBNA-LP coexpression in newly infected B cells and the efficiency of B-cell transformation: a rationale for the multiple W repeats in wild-type virus strains

Affiliations

Epstein-Barr virus BamHI W repeat number limits EBNA2/EBNA-LP coexpression in newly infected B cells and the efficiency of B-cell transformation: a rationale for the multiple W repeats in wild-type virus strains

Rosemary J Tierney et al. J Virol. 2011 Dec.

Abstract

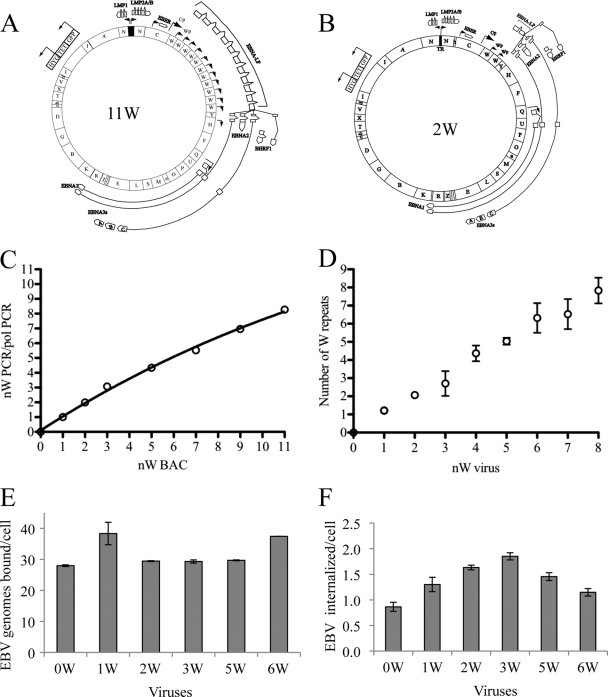
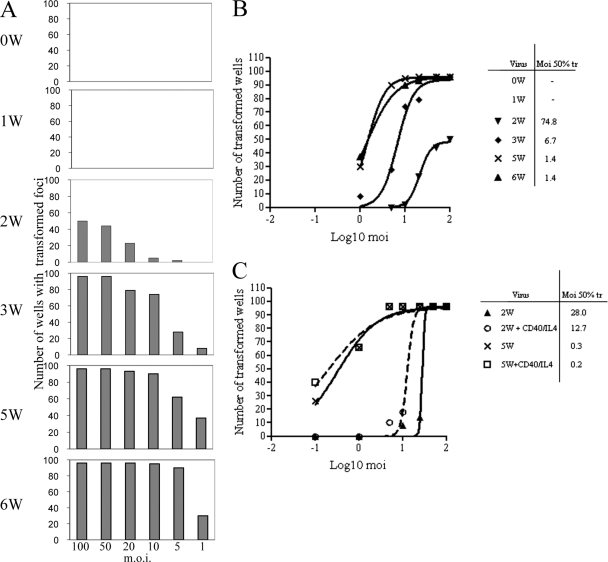
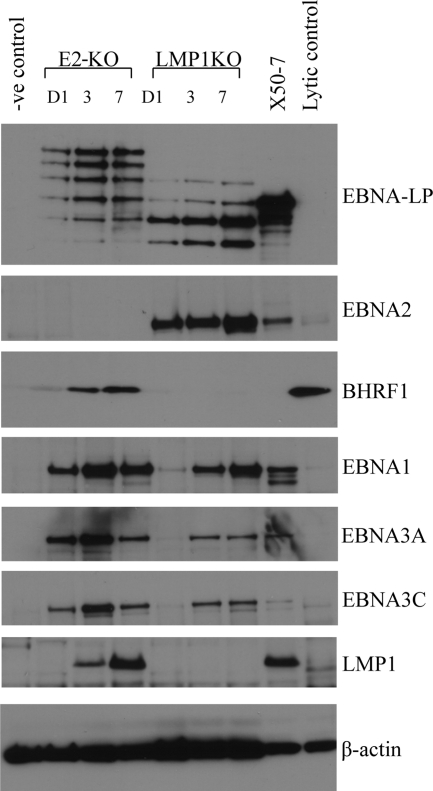
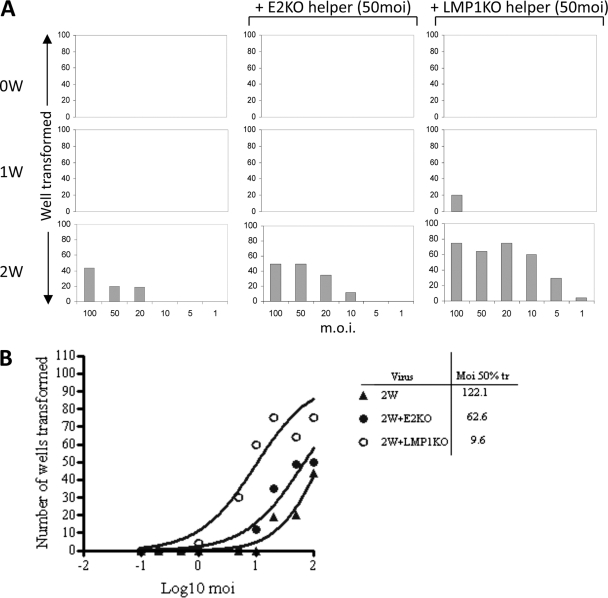
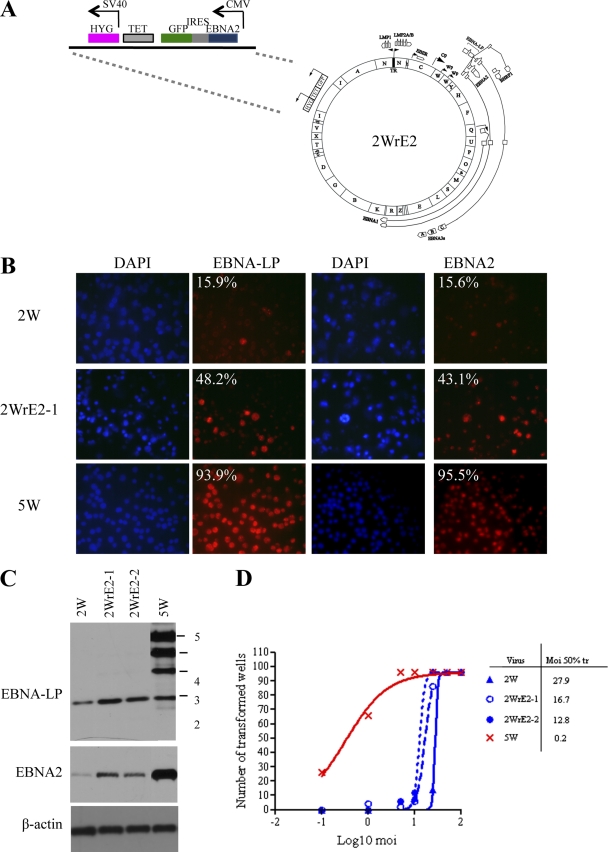
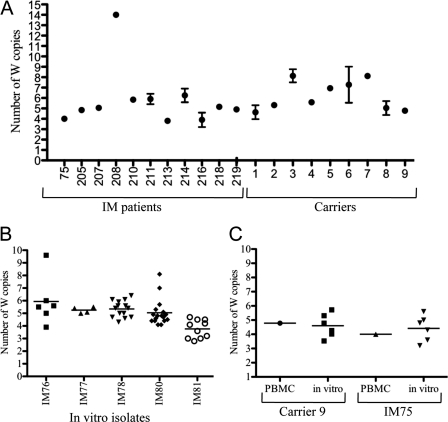
The genome of Epstein-Barr virus (EBV), a gammaherpesvirus with potent B-cell growth-transforming ability, contains multiple copies of a 3-kb BamHI W repeat sequence; each repeat carries (i) a promoter (Wp) that initiates transformation by driving EBNA-LP and EBNA2 expression and (ii) the W1W2 exons encoding the functionally active repeat domain of EBNA-LP. The W repeat copy number of a virus therefore influences two potential determinants of its transforming ability: the number of available Wp copies and the maximum size of the encoded EBNA-LP. Here, using recombinant EBVs, we show that optimal B-cell transformation requires a minimum of 5 W repeats (5W); the levels of transforming ability fall progressively with viruses carrying 4, 3, and 2 W repeats, as do the levels of Wp-initiated transcripts expressed early postinfection (p.i.), while viruses with 1 copy of the wild-type W repeat (1W) and 0W are completely nontransforming. We therefore suggest that genetic analyses of EBV transforming function should ensure that wild-type and mutant strains have equal numbers (ideally at least 5) of W copies if the analysis is not to be compromised. Attempts to enhance the transforming function of low-W-copy-number viruses, via the activity of helper EBV strains or by gene repair, suggested that the critical defect is not related to EBNA-LP size but to the failure to achieve sufficiently strong coexpression of EBNA-LP and EBNA2 early postinfection. We further show by the results of ex vivo assays that EBV strains in the blood of infected individuals typically have a mean of 5 to 8 W copies, consistent with the view that evolution has selected for viruses with an optimal transforming function.


Figures

Fig. 1.
Fig. 1.
(A) Map of the B95.8 EBV strain-derived 11W BAC genome. The positions of the BamHI fragments (indicated by letters) are shown on the inner circle, promoters are represented as solid black arrows, and the spliced latent gene transcript exons, represented as boxes and connecting lines, are shown in their relative positions around the genome. (B) Map of the 11W-derived 2W BAC genome; the genome differs from that represented by panel A only in the number of BamHI W repeats and thus contains only 2 Wp promoters and produces a shorter EBNA-LP transcript. (C) A standard curve relating W QPCR signal per genome to the number of W repeats. nW and Pol PCRs (minimum of 4 replicates) were performed on a panel of BACs with known numbers of W repeats (as determined by EcoRI-HindIII restriction digestion); the ratio of mean nW PCR quantity to mean Pol PCR quantity is plotted against the number of W repeats. (D) Measurement of W repeat numbers in virus preparations. Virus preparations (1 to 4 per nW virus) were subjected to nW and Pol QPCR amplification, the nW/Pol ratio was calculated, and the numbers of W repeats were determined from the standard curve shown in panel C. (E) A representative binding assay performed on 1 × 10⁶ B cells incubated with the 0W to 6W viruses at an MOI of 50. Data shown represent the means of the results of triplicate QPCR assays. (F) A representative nW virus internalization assay was performed on 1 × 10⁶ B cells infected at an MOI of 50. Data shown represent the means of the results of triplicate QPCR assays.
Fig. 2.
Fig. 2.
(A) EBV latent gene transcription in primary B cells infected with the 0W to 6W viruses. Wp, BHRF1, EBNA2, and Cp transcripts were assayed by QRT-PCR at days 1, 2, and 3 in B cells exposed to the indicated viruses at an MOI of 50. Transcripts were normalized against GAPDH (glyceraldehyde-3-phosphate dehydrogenase); values are expressed relative to those of a standard LCL (value = 1). (B) EBV latent antigen expression in B cells infected with viruses 2W to 6W. Immunofluorescence staining was performed for EBNA-LP and EBNA2 (red) in primary B cells exposed to virus at an MOI of 50 at 3 days p.i. DAPI (blue) staining shows all nuclei in the field. The percentages of cells positive for EBNA-LP and EBNA2 are shown in the corners of the images.
Fig. 3.
Fig. 3.
Transformation assays performed with nW viruses. (A) Histograms representing the numbers of 96 replicate wells, each seeded at 104 cells/well, that transformed after infection of cells with the 0W to 6W viruses at the indicated MOI; the data represent the results from one representative assay scored at 6 weeks p.i. (B) Calculation of the transformation efficiency of the 0W to 6W viruses. The MOI required for transformation of 50% of the wells (Moi 50% tr) was determined by plotting the number of transformed wells as shown in panel A against the log10 MOI. (C) The effect of a mitogenic signal on transformation. Transformation assays were carried out as described for panel A with the 2W and 5W viruses with or without the addition of soluble CD40 ligand (50 ng/ml) and IL-4 (50 ng/ml). The numbers of wells showing transformation at 6 weeks p.i. were plotted against the log10 MOI to determine the MOI required for transformation of 50% of the wells.
Fig. 4.
Fig. 4.
EBV latent gene expression in B cells infected with EBNA2 KO (E2-KO) and LMP1-KO helper viruses at an MOI of 50. Western blot assays were carried out to detect EBNA-LP, EBNA2, BHRF1, EBNA1, EBNA3A, EBNA3C, and LMP1 expression at days 1, 3, and 7 p.i. Primary uninfected B cells served as a negative control (-ve), the EBV-transformed X50-7 cell line was used as a positive control for EBNA-LP, EBNA-2, EBNA1, EBNA3A, EBNA3C, and LMP1 expression, and Akata-BL cells induced into lytic replication by surface IgG cross-linking (60% cells in the lytic cycle) were used as a positive control for BHRF1 expression (lytic control). β-Actin blotting served as a loading control.
Fig. 5.
Fig. 5.
Transformation assays with nW and helper viruses. (A) Primary B cells were exposed to viruses at each of the indicated MOIs (as described for Fig. 1) with or without the addition of the E2-KO or LMP1-KO helper virus at a constant MOI of 50. The numbers of wells showing transformation were scored at 6 weeks p.i. (B) The results of the transformation assays described for panel A were plotted as the numbers of transformed wells versus the log10 MOI to determine the MOI required for 50% transformation.
Fig. 6.
Fig. 6.
EBNA-LP repair of the 2W virus. (A) Map of the 2WrLP BAC, including details of the EBNA-LP expression cassette that was recombined into the 2W BAC genome in place of the green fluorescent protein (GFP)-tetracycline-hygromycin selection cassette. (B) EBV latent antigen expression in B cells infected with 2W, EBNA-LP-repaired 2WrLP-1, and 5W viruses. Immunofluorescence staining was performed for EBNA-LP and EBNA2 in primary B cells exposed to virus at an MOI of 50 at 3 days p.i. DAPI (blue) staining shows all nuclei in the field. The percentages of cells positive for EBNA-LP and EBNA2 (red) staining are shown in the corners of the images. (C) EBNA-LP and EBNA2 expression in 2WrLP-infected cells. Primary B cells were infected with 2WrLP virus preparations derived from 2 different 293 producer clones (2WrLP-1 and -2) or with 2W and 5W control viruses at an MOI of 50. Cell lysates at 3 days postinfection were subjected to Western blotting to determine levels of EBNA-LP and EBNA2 expression, with β-actin serving as a loading control. (D) Transformation efficiency of the EBNA-LP-repaired virus. Transformation assays were carried out with 2WrLP-1 and -2 or with 2W and 5W control viruses (as described for Fig. 1) to determine the efficiency of transformation; the results are expressed as the MOIs required for 50% transformation.
Fig. 7.
Fig. 7.
EBNA-2 repair of the 2W virus. (A) Map of the 2WrE2 BAC, including details of the EBNA2 expression cassette that was recombined into the 2W BAC genome in place of the GFP-tetracycline-hygromycin selection cassette. (B) EBV latent antigen expression in B cells infected with 2W, EBNA2-repaired 2WrE2-1, and 5W viruses. Immunofluorescence staining was performed for EBNA-LP and EBNA2 in primary B cells exposed to virus at an MOI of 50 at 3 days p.i. DAPI (blue) staining shows all nuclei in the field. The percentages of cells positive for EBNA-LP and EBNA2 (red) staining are shown in the corners of the images. (C) EBNA-LP and EBNA2 expression in 2WrE2-infected cells. Primary B cells were infected with 2WrE2 virus preparations derived from 2 different 293 producer clones (2WrE2-1 and -2) or 2W and 5W control viruses at an MOI of 50. Cell lysates at 3 days postinfection were subjected to Western blotting to determine levels of EBNA-LP and EBNA2 expression, with β-actin serving as a loading control. (D) Transformation efficiency of the EBNA2-repaired virus. Transformation assays were carried out with 2WrE2-1 and -2 or with 2W and 5W control viruses (as described for Fig. 1) to determine the efficiency of transformation, expressed as the MOI required for 50% transformation.
Fig. 8.
Fig. 8.
The numbers of W repeats in naturally occurring virus strains. (A) The numbers of W repeats in ex vivo samples. A PBMC sample from each of 11 IM patients and 9 healthy virus carriers was subjected to nW and Pol QPCR (3 to 4 replicates) in order to calculate the number of W repeats in resident EBV genomes. The means and standard errors are shown. (B) The number of W repeats in in vitro isolates. For 5 IM donors, multiple independent in vitro spontaneously transformed cell lines, derived from a single bleed, were subjected to nW and Pol QPCR (in duplicate) in order to calculate the number of W repeats in the resident virus strain. The mean QPCR result for each cell line is shown as an individual point and the mean value for all the cell lines from each donor as a horizontal line. (C) Comparison of the number of W repeats in ex vivo PBMCs and in vitro isolates from the same bleed of one IM patient and one virus carrier. For each sample, the mean of the results of nW and Pol PCRs (carried out in duplicate) is shown as an individual point and the mean value for all the cell lines from each donor as a horizontal line.

Similar articles

Cited by

References

    1. Allan G. J., Rowe D. T. 1989. Size and stability of the Epstein-Barr virus major internal repeat (IR-1) in Burkitt's lymphoma and lymphoblastoid cell lines. Virology 173:489–498 - PubMed
    1. Altmann M., Hammerschmidt W. 2005. Epstein-Barr virus provides a new paradigm: a requirement for the immediate inhibition of apoptosis. PLoS Biol. 3:e404. - PMC - PubMed
    1. Amoroso R., et al. 2011. Quantitative studies of Epstein-Barr virus-encoded microRNAs provide novel insights into their regulation. J. Virol. 85:996–1010 - PMC - PubMed
    1. Baer R., et al. 1984. DNA sequence and expression of the B95-8 Epstein-Barr virus genome. Nature 310:207–211 - PubMed
    1. Bell A., Skinner J., Kirby H., Rickinson A. 1998. Characterisation of regulatory sequences at the Epstein-Barr virus BamHI W promoter. Virology 252:149–161 - PubMed

Publication types

MeSH terms

Substances

LinkOut - more resources