. 2011 Nov;60(11):2861-71.
doi: 10.2337/db11-0440. Epub 2011 Sep 27.

Specific control of pancreatic endocrine β- and δ-cell mass by class IIa histone deacetylases HDAC4, HDAC5, and HDAC9

Affiliations

Specific control of pancreatic endocrine β- and δ-cell mass by class IIa histone deacetylases HDAC4, HDAC5, and HDAC9

Olivia Lenoir et al. Diabetes. 2011 Nov.

Abstract

Objective: Class IIa histone deacetylases (HDACs) belong to a large family of enzymes involved in protein deacetylation and play a role in regulating gene expression and cell differentiation. Previously, we showed that HDAC inhibitors modify the timing and determination of pancreatic cell fate. The aim of this study was to determine the role of class IIa HDACs in pancreas development.

Research design and methods: We took a genetic approach and analyzed the pancreatic phenotype of mice lacking HDAC4, -5, and -9. We also developed a novel method of lentiviral infection of pancreatic explants and performed gain-of-function experiments.

Results: We show that class IIa HDAC4, -5, and -9 have an unexpected restricted expression in the endocrine β- and δ-cells of the pancreas. Analyses of the pancreas of class IIa HDAC mutant mice revealed an increased pool of insulin-producing β-cells in Hdac5(-/-) and Hdac9(-/-) mice and an increased pool of somatostatin-producing δ-cells in Hdac4(-/-) and Hdac5(-/-) mice. Conversely, HDAC4 and HDAC5 overexpression showed a decreased pool of insulin-producing β-cells and somatostatin-producing δ-cells. Finally, treatment of pancreatic explants with the selective class IIa HDAC inhibitor MC1568 enhances expression of Pax4, a key factor required for proper β-and δ-cell differentiation and amplifies endocrine β- and δ-cells.

Conclusions: We conclude that HDAC4, -5, and -9 are key regulators to control the pancreatic β/δ-cell lineage. These results highlight the epigenetic mechanisms underlying the regulation of endocrine cell development and suggest new strategies for β-cell differentiation-based therapies.


Figures

FIG. 1.
FIG. 1.
HDAC4 is highly enriched in endocrine cells at a high level in δ-cells and at a low level in β-cells. A: qPCR analysis of Hdac4 mRNA expression in embryonic pancreas, adult islets, and adult exocrine tissue. B–D: Immunohistological analysis of HDAC4 (green) in E15.5 and adult pancreata. B: β-Cells were detected with insulin (INS) staining (red), and cells coexpressing HDAC4 and insulin (orange) are shown in the merge. C: δ-Cells were detected with somatostatin (SST) staining (red), and cells coexpressing HDAC4 and somatostatin (yellow) are shown in the merge. D: α-Cells were detected with glucagon (GLU) staining (red). No cells coexpressing HDAC4 and glucagon were observed in the merge. Nuclei were stained with Hoechst stain (blue). Scale bar, 50 μm. Endocrine islets are circled. A higher magnification of selected cells is shown in the insets. (A high-quality digital representation of this figure is available in the online issue.)
FIG. 2.
FIG. 2.
HDAC5 is highly enriched in β- and δ-cells. A: qPCR analysis of Hdac5 mRNA expression in embryonic pancreas, adult islets, and adult exocrine tissue. B–D: Immunohistological analysis of HDAC5 (brown) in E15.5 and adult pancreas. B: β-Cells were detected with insulin (INS) staining (red) and PDX1 staining (green) was used to detect pancreatic epithelium (PDX1low) and β-cells (PDX1high). Some β-cell PDX1high+/insulin+ expressing HDAC5 are framed. C: β- and α-cells were detected using insulin (red) and glucagon (GLU) (green) staining, respectively. Some β-cell insulin+/HDAC5+ and some α-cell glucagon+/HDAC5 are framed. D: δ-Cells were detected with somatostatin (SST) staining (green), and the arrow shows a δ-cell somatostatin+/HDAC5+. Nuclei were stained with Hoechst stain (blue). Scale bar, 50 μm (B and C) and 10 μm (D). (A high-quality digital representation of this figure is available in the online issue.)
FIG. 3.
FIG. 3.
HDAC9 is highly enriched in β-cells. A: qPCR analysis of Hdac9 mRNA expression in embryonic pancreas, adult islets, and adult exocrine tissue. B–D: Immunohistological analysis of HDAC9 (green) in E15.5 and P7 pancreata. B: β-Cells were detected with insulin (INS) staining (red), and cells coexpressing HDAC9 and insulin (yellow) are shown in the merge. C: δ-Cells were detected with somatostatin (SST) staining (red). No cells coexpressing HDAC9 (green) and somatostatin (red) are observed in the merge. D: α-Cells were detected with glucagon (GLU) staining (red). No cells coexpressing HDAC9 (green) and glucagon (red) are observed in the merge. Nuclei were stained with Hoechst stain (blue). Scale bar, 50 μm. Endocrine islets are circled. A higher magnification of selected cells is shown in the insets. (A high-quality digital representation of this figure is available in the online issue.)
FIG. 4.
FIG. 4.
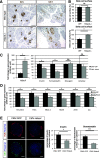
HDAC4 loss-of-function enhances δ-cell mass, whereas HDAC4 gain-of-function represses β- and δ-cell mass. A: Immunohistological analyses of wild-type and Hdac4−/− pancreas at P1. β-Cells and δ-cells were detected with insulin (INS) (brown, left panels) and somatostatin (SST) (brown, right panels) stainings. B: Morphometric analysis of β- and δ-cell surfaces by quantification of areas occupied by insulin- and somatostatin-positive cells. β-Cell and δ-cell surfaces were normalized to wild-type (WT) values (100%). Data are shown as means ± SEM. Four pancreata were analyzed for each genotype. C: qPCR analysis of Hdac4,insulin, somatostatin, glucagon, and amylase mRNA expression in pancreatic spheres transduced with CMV-GFP or CMV-HDAC4 lentivirus, followed by a 7-day culture period. D: qPCR analysis of NeuroD1, Pdx1, MafA, Nkx2.2, Znt8, and Ia1 mRNA expression in pancreatic spheres transduced with CMV-GFP or CMV-HDAC4 lentivirus, followed by a 7-day culture period. E: Immunohistological analyses of pancreatic spheres transduced with a lentivirus expressing enhanced GFP or HDAC4 followed by a 7-day culture period. β-Cells and δ-cells were detected with insulin (red) and antibody somatostatin (green) stainings. Nuclei were stained with Hoechst stain (blue). The absolute areas that were occupied by the insulin- and somatostatin-positive cells were quantified. β- and δ-Cell areas are presented as a percentage of the total tissue area. qPCR data and immunohistological analyses are the means ± SEM of five and six independent experiments, respectively. *P < 0.05; **P < 0.005; ***P < 0.001. Scale bar, 100 μm (A) and 50 μm (E). (A high-quality digital representation of this figure is available in the online issue.)
FIG. 5.
FIG. 5.
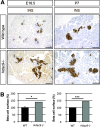
HDAC5 loss-of-function enhances β- and δ-cell mass. A: Immunohistological analyses of wild-type and Hdac5−/− pancreas at E18.5 and P7. On the left panel, β-cells were detected with insulin (INS) staining (brown) at E18.5. On the middle panel, β-cells were detected with insulin staining (brown) at P7. On the right panel, δ-cells were detected with somatostatin (SST) staining (brown) at P7. B: Morphometric analysis of β- and δ-cell surfaces by quantification of areas occupied by insulin- and somatostatin-positive cells. β-Cell surface is shown at E18.5 on the left panel and at P7 on the middle panel. δ-Cell surface is shown at P7 on the right panel. β-Cell and δ-cell surfaces were normalized to wild-type (WT) values (100%). Data are shown as means ± SEM from at least three pancreata per genotype. At E18.5, we analyzed three WT and five Hdac5−/− pancreata. At P7, we analyzed four pancreata of each genotype. *P < 0.05; **P < 0.005; ***P < 0.001. Scale bar, 100 μm. (A high-quality digital representation of this figure is available in the online issue.)
FIG. 6.
FIG. 6.
HDAC5 gain-of-function represses β- and δ-cell mass. A: qPCR analysis of Hdac5,insulin, somatostatin, glucagon, and amylase mRNAs expression in pancreatic spheres transduced with CMV-GFP or CMV-HDAC4 lentivirus, followed by a 7-day culture period. B: qPCR analysis of NeuroD1, Pdx1, MafA, Nkx2.2, Znt8, and Ia1 mRNA expression in pancreatic spheres transduced with CMV-GFP or CMV-HDAC5 lentivirus, followed by a 7-day culture period. C: Immunohistological analyses of pancreatic spheres transduced with a lentivirus expressing eGFP or HDAC5 followed by a 7-day culture period. β-Cells and δ-cells were detected with insulin (INS) (red) and antibody somatostatin (SST) (green) stainings. Nuclei were stained with Hoechst stain (blue). The absolute areas that were occupied by the insulin- and somatostatin-positive cells were quantified. β-Cell and δ-cell areas are presented as a percentage of the total tissue area. qPCR data and immunohistological analyses are the means ± SEM of three and four independent experiments, respectively. *P < 0.05; **P < 0.005; ***P < 0.001. Scale bar, 50 μm. (A high-quality digital representation of this figure is available in the online issue.)
FIG. 7.
FIG. 7.
HDAC9 loss-of-function enhances β-cell mass. A: Immunohistological analyses of wild-type and Hdac9−/− pancreas at E18.5 and P7. β-Cells were detected with insulin (INS) staining (brown). B: Morphometric analysis of the β-cell surface by quantification of areas occupied by insulin-positive cells. β-Cell surfaces were normalized to wild-type (WT) values (100%). Data are shown as means ± SEM. At E18.5, we analyzed five WT and four Hdac9−/− pancreata. At P7, we analyzed four WT and three Hdac9−/− pancreata. *P < 0.05; ***P < 0.001. Scale bar, 100 μm. (A high-quality digital representation of this figure is available in the online issue.)
FIG. 8.
FIG. 8.
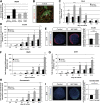
The MEF2 transcription factors are expressed in the pancreas and the MC1568 inhibitor increases β- and δ-cell mass. A: qPCR analysis of Mef2A expression in E15.5 and E18.5 mouse pancreas, and E18.5 heart and muscle. B: Immunohistological analysis of MEF2A (red) in E18.5 mouse pancreas. β-Cells were detected with insulin (INS) staining (green). The arrow shows one cell coexpressing MEFA2 and insulin. C: qPCR analysis of Pax4 mRNA expression between 3 and 14 days in culture (D3 to D14), in E13.5 pancreatic explants that were treated or not with MC1568 during 14 days. D: qPCR analysis of insulin mRNA expression from D3 to D14 in cultured pancreatic explants that were treated or not with MC1568. E: Immunohistological analyses of pancreata after 7 days in culture, with and without MC1568 treatment. β-Cell development was evaluated with insulin staining (red). Absolute areas that were occupied by the insulin-positive cells were quantified. F: qPCR analysis of MafA mRNA expression from D3 to D14 in pancreatic explants treated or not with MC1568. G: qPCR analysis of Znt8 mRNA expression from D3 to D14 in pancreatic explants treated or not with MC1568. H: qPCR analysis of somatostatin mRNA expression from D3 to D14 in pancreatic explants treated or not with MC1568. I: Immunohistological analyses of pancreata after 7 days in culture, with and without MC1568 treatment. δ-Cell development was evaluated with somatostatin (SST) staining (green). Absolute areas that were occupied by the somatostatin-positive cells were quantified. In E and I, nuclei were stained with Hoechst stain (blue). qPCR data and immunohistological analyses are the means ± SEM of four and six independent experiments, respectively. *P < 0.05; **P < 0.005; ***P < 0.001. Scale bar, 50 μm. (A high-quality digital representation of this figure is available in the online issue.)

Similar articles

Cited by

References

    1. Jonsson J, Carlsson L, Edlund T, Edlund H. Insulin-promoter-factor 1 is required for pancreas development in mice. Nature 1994;371:606–609 - PubMed
    1. Gradwohl G, Dierich A, LeMeur M, Guillemot F. Neurogenin3 is required for the development of the four endocrine cell lineages of the pancreas. Proc Natl Acad Sci U S A 2000;97:1607–1611 - PMC - PubMed
    1. Collombat P, Hecksher-Sørensen J, Serup P, Mansouri A. Specifying pancreatic endocrine cell fates. Mech Dev 2006;123:501–512 - PubMed
    1. Sosa-Pineda B, Chowdhury K, Torres M, Oliver G, Gruss P. The Pax4 gene is essential for differentiation of insulin-producing beta cells in the mammalian pancreas. Nature 1997;386:399–402 - PubMed
    1. Collombat P, Mansouri A, Hecksher-Sorensen J, et al. . Opposing actions of Arx and Pax4 in endocrine pancreas development. Genes Dev 2003;17:2591–2603 - PMC - PubMed

Publication types

MeSH terms