Grafted human-induced pluripotent stem-cell-derived neurospheres promote motor functional recovery after spinal cord injury in mice
- PMID: 21949375
- PMCID: PMC3189018
- DOI: 10.1073/pnas.1108077108
Grafted human-induced pluripotent stem-cell-derived neurospheres promote motor functional recovery after spinal cord injury in mice
Abstract
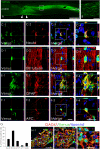
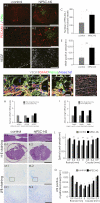
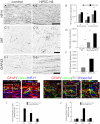
Once their safety is confirmed, human-induced pluripotent stem cells (hiPSCs), which do not entail ethical concerns, may become a preferred cell source for regenerative medicine. Here, we investigated the therapeutic potential of transplanting hiPSC-derived neurospheres (hiPSC-NSs) into nonobese diabetic (NOD)-severe combined immunodeficient (SCID) mice to treat spinal cord injury (SCI). For this, we used a hiPSC clone (201B7), established by transducing four reprogramming factors (Oct3/4, Sox2, Klf4, and c-Myc) into adult human fibroblasts. Grafted hiPSC-NSs survived, migrated, and differentiated into the three major neural lineages (neurons, astrocytes, and oligodendrocytes) within the injured spinal cord. They showed both cell-autonomous and noncell-autonomous (trophic) effects, including synapse formation between hiPSC-NS-derived neurons and host mouse neurons, expression of neurotrophic factors, angiogenesis, axonal regrowth, and increased amounts of myelin in the injured area. These positive effects resulted in significantly better functional recovery compared with vehicle-treated control animals, and the recovery persisted through the end of the observation period, 112 d post-SCI. No tumor formation was observed in the hiPSC-NS-grafted mice. These findings suggest that hiPSCs give rise to neural stem/progenitor cells that support improved function post-SCI and are a promising cell source for its treatment.
Conflict of interest statement
The authors declare no conflict of interest.
Figures


Similar articles
-
Pre-evaluated safe human iPSC-derived neural stem cells promote functional recovery after spinal cord injury in common marmoset without tumorigenicity.PLoS One. 2012;7(12):e52787. doi: 10.1371/journal.pone.0052787. Epub 2012 Dec 27. PLoS One. 2012. PMID: 23300777 Free PMC article.
-
[Regeneration of the central nervous system using iPS cell-technologies].Rinsho Shinkeigaku. 2009 Nov;49(11):825-6. doi: 10.5692/clinicalneurol.49.825. Rinsho Shinkeigaku. 2009. PMID: 20030221 Review. Japanese.
-
Therapeutic potential of appropriately evaluated safe-induced pluripotent stem cells for spinal cord injury.Proc Natl Acad Sci U S A. 2010 Jul 13;107(28):12704-9. doi: 10.1073/pnas.0910106107. Epub 2010 Jul 6. Proc Natl Acad Sci U S A. 2010. PMID: 20615974 Free PMC article.
-
Therapeutic potential of induced neural stem cells for spinal cord injury.J Biol Chem. 2014 Nov 21;289(47):32512-25. doi: 10.1074/jbc.M114.588871. Epub 2014 Oct 6. J Biol Chem. 2014. PMID: 25294882 Free PMC article.
-
[Therapeutic potential of induced pluripotent stem cells for spinal cord injury].Brain Nerve. 2012 Jan;64(1):17-27. Brain Nerve. 2012. PMID: 22223498 Review. Japanese.
Cited by
-
Neuron-derived exosomes-transmitted miR-124-3p protect traumatically injured spinal cord by suppressing the activation of neurotoxic microglia and astrocytes.J Nanobiotechnology. 2020 Jul 25;18(1):105. doi: 10.1186/s12951-020-00665-8. J Nanobiotechnology. 2020. PMID: 32711535 Free PMC article.
-
Long-term safety issues of iPSC-based cell therapy in a spinal cord injury model: oncogenic transformation with epithelial-mesenchymal transition.Stem Cell Reports. 2015 Mar 10;4(3):360-73. doi: 10.1016/j.stemcr.2015.01.006. Epub 2015 Feb 13. Stem Cell Reports. 2015. PMID: 25684226 Free PMC article.
-
Induced pluripotent stem cells for spinal cord injury therapy: current status and perspective.Neurol Sci. 2013 Jan;34(1):11-7. doi: 10.1007/s10072-012-1145-3. Epub 2012 Jul 15. Neurol Sci. 2013. PMID: 22797773 Review.
-
hiPSC-derived NSCs effectively promote the functional recovery of acute spinal cord injury in mice.Stem Cell Res Ther. 2021 Mar 11;12(1):172. doi: 10.1186/s13287-021-02217-9. Stem Cell Res Ther. 2021. PMID: 33706803 Free PMC article.
-
A selective cytotoxic adenovirus vector for concentration of pluripotent stem cells in human pluripotent stem cell-derived neural progenitor cells.Sci Rep. 2021 Jun 1;11(1):11407. doi: 10.1038/s41598-021-90928-7. Sci Rep. 2021. PMID: 34075124 Free PMC article.
References
-
- Björklund A, Lindvall O. Cell replacement therapies for central nervous system disorders. Nat Neurosci. 2000;3:537–544. - PubMed
-
- Gage FH. Mammalian neural stem cells. Science. 2000;287:1433–1438. - PubMed
-
- Lindvall O, Kokaia Z. Stem cells for the treatment of neurological disorders. Nature. 2006;441:1094–1096. - PubMed
Publication types
MeSH terms
LinkOut - more resources
Full Text Sources
Other Literature Sources
Medical
Molecular Biology Databases
Miscellaneous

