The proteomes of transcription factories containing RNA polymerases I, II or III
- PMID: 21946667
- PMCID: PMC3324775
- DOI: 10.1038/nmeth.1705
The proteomes of transcription factories containing RNA polymerases I, II or III
Abstract
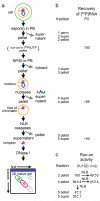
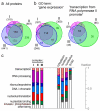
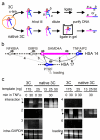
Human nuclei contain three RNA polymerases (I, II and III) that transcribe different groups of genes; the active forms of all three are difficult to isolate because they are bound to the substructure. Here we describe a purification approach for isolating active RNA polymerase complexes from mammalian cells. After isolation, we analyzed their protein content by mass spectrometry. Each complex represents part of the core of a transcription factory. For example, the RNA polymerase II complex contains subunits unique to RNA polymerase II plus various transcription factors but shares a number of ribonucleoproteins with the other polymerase complexes; it is also rich in polymerase II transcripts. We also describe a native chromosome conformation capture method to confirm that the complexes remain attached to the same pairs of DNA templates found in vivo.
Figures


Similar articles
-
Active RNA polymerases are localized within discrete transcription "factories' in human nuclei.J Cell Sci. 1996 Jun;109 ( Pt 6):1427-36. doi: 10.1242/jcs.109.6.1427. J Cell Sci. 1996. PMID: 8799830
-
Numbers and organization of RNA polymerases, nascent transcripts, and transcription units in HeLa nuclei.Mol Biol Cell. 1998 Jun;9(6):1523-36. doi: 10.1091/mbc.9.6.1523. Mol Biol Cell. 1998. PMID: 9614191 Free PMC article.
-
Purification of yeast RNA polymerases using heparin agarose affinity chromatography. Transcriptional properties of the purified enzymes on defined templates.J Biol Chem. 1983 Mar 10;258(5):3230-41. J Biol Chem. 1983. PMID: 6298228
-
Specialized transcription factories within mammalian nuclei.Crit Rev Eukaryot Gene Expr. 2000;10(1):21-9. Crit Rev Eukaryot Gene Expr. 2000. PMID: 10813391 Review.
-
Transcription factories: quantitative studies of nanostructures in the mammalian nucleus.Chromosome Res. 2003;11(5):461-70. doi: 10.1023/a:1024926710797. Chromosome Res. 2003. PMID: 12971722 Review.
Cited by
-
RNA polymerase II transcription elongation control.Chem Rev. 2013 Nov 13;113(11):8583-603. doi: 10.1021/cr400105n. Epub 2013 Aug 6. Chem Rev. 2013. PMID: 23919563 Free PMC article. Review. No abstract available.
-
RNA polymerase II C-terminal domain: Tethering transcription to transcript and template.Chem Rev. 2013 Nov 13;113(11):8423-55. doi: 10.1021/cr400158h. Epub 2013 Sep 16. Chem Rev. 2013. PMID: 24040939 Free PMC article. Review. No abstract available.
-
Drosophila CTCF tandemly aligns with other insulator proteins at the borders of H3K27me3 domains.Genome Res. 2012 Nov;22(11):2176-87. doi: 10.1101/gr.136788.111. Epub 2012 Jun 21. Genome Res. 2012. PMID: 22722341 Free PMC article.
-
Myb-binding protein 1a (Mybbp1a) regulates levels and processing of pre-ribosomal RNA.J Biol Chem. 2012 Jul 13;287(29):24365-77. doi: 10.1074/jbc.M111.303719. Epub 2012 May 29. J Biol Chem. 2012. PMID: 22645127 Free PMC article.
-
Dissecting the nascent human transcriptome by analysing the RNA content of transcription factories.Nucleic Acids Res. 2015 Aug 18;43(14):e95. doi: 10.1093/nar/gkv390. Epub 2015 Apr 20. Nucleic Acids Res. 2015. PMID: 25897132 Free PMC article.
References
-
- Roeder RG. The eukaryotic transcriptional machinery: complexities and mechanisms unforeseen. Nat. Med. 2003;9:1239–1244. - PubMed
-
- Cramer P, et al. Structure of eukaryotic RNA polymerases. Annu. Rev. Biophys. 2008;37:337–352. - PubMed
-
- Das R, et al. SR proteins function in coupling RNAP II transcription to pre-mRNA splicing. Mol. Cell. 2007;26:867–881. - PubMed
-
- Cook PR. A model for all genomes; the role of transcription factories. J. Mol. Biol. 2010;395:1–10. - PubMed
Publication types
MeSH terms
Substances
Grants and funding
LinkOut - more resources
Full Text Sources

