The HIV-1 gp120/V3 modifies the response of uninfected CD4 T cells to antigen presentation: mapping of the specific transcriptional signature
- PMID: 21943198
- PMCID: PMC3203262
- DOI: 10.1186/1479-5876-9-160
The HIV-1 gp120/V3 modifies the response of uninfected CD4 T cells to antigen presentation: mapping of the specific transcriptional signature
Abstract
Background: The asymptomatic phase of HIV-1 infection is characterized by a progressive depletion of uninfected peripheral effector/memory CD4+ T cells that subsequently leads to immune dysfunction and AIDS symptoms. We have previously demonstrated that the presence of specific gp120/V3 peptides during antigen presentation can modify the activation of normal T-cells leading to altered immune function. The aim of the present study was to map the specific transcriptional profile invoked by an HIV-1/V3 epitope in uninfected T cells during antigen presentation.
Methods: We exposed primary human peripheral blood monocytes to V3 lipopeptides using a liposome delivery system followed by a superantigen-mediated antigen presentation system. We then evaluated the changes in the T-cell transcriptional profile using oligonucleotide microarrays and performed Ingenuity Pathway Analysis (IPA) and DAVID analysis. The results were validated using realtime PCR, FACS, Western blotting and immunofluorescence.
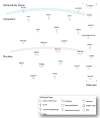
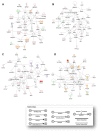
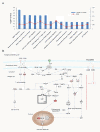
Results: Our results revealed that the most highly modulated transcripts could almost entirely be categorized as related to the cell cycle or transcriptional regulation. The most statistically significant enriched categories and networks identified by IPA were associated with cell cycle, gene expression, immune response, infection mechanisms, cellular growth, proliferation and antigen presentation. Canonical pathways involved in energy and cell cycle regulation, and in the co-activation of T cells were also enriched.
Conclusions: Taken together, these results document a distinct transcriptional profile invoked by the HIV-1/V3 epitope. These data could be invaluable to determine the underlying mechanism by which HIV-1 epitopes interfere with uninfected CD4+ T-cell function causing hyper proliferation and AICD.
Figures


Similar articles
-
HIV-1 gp120/V3-derived epitopes promote activation-induced cell death to superantigen-stimulated CD4+/CD45RO+ T cells.Immunol Lett. 2007 Jan 15;108(1):97-102. doi: 10.1016/j.imlet.2006.11.002. Epub 2006 Nov 27. Immunol Lett. 2007. PMID: 17141881
-
Shared antigenic epitopes on the V3 loop of HIV-1 gp120 and proteins on activated human T cells.Virology. 1998 Jun 20;246(1):53-62. doi: 10.1006/viro.1998.9185. Virology. 1998. PMID: 9656993
-
Dys-regulation of effector CD4+ T cell function by the V3 domain of the HIV-1 gp120 during antigen presentation.Biochem Biophys Res Commun. 2001 Jun 22;284(4):875-9. doi: 10.1006/bbrc.2001.5046. Biochem Biophys Res Commun. 2001. PMID: 11409875
-
HIV-1 proteins in infected cells determine the presentation of viral peptides by HLA class I and class II molecules and the nature of the cellular and humoral antiviral immune responses--a review.Virus Genes. 1994 Jul;8(3):249-70. doi: 10.1007/BF01704519. Virus Genes. 1994. PMID: 7975271 Review.
-
Foxo3a: an integrator of immune dysfunction during HIV infection.Cytokine Growth Factor Rev. 2012 Aug-Oct;23(4-5):215-21. doi: 10.1016/j.cytogfr.2012.05.008. Epub 2012 Jun 27. Cytokine Growth Factor Rev. 2012. PMID: 22748238 Free PMC article. Review.
Cited by
-
Expansion of monocytic myeloid-derived suppressor cells dampens T cell function in HIV-1-seropositive individuals.J Virol. 2013 Feb;87(3):1477-90. doi: 10.1128/JVI.01759-12. Epub 2012 Nov 14. J Virol. 2013. PMID: 23152536 Free PMC article.
-
Differentially-Expressed Pseudogenes in HIV-1 Infection.Viruses. 2015 Sep 29;7(10):5191-205. doi: 10.3390/v7102869. Viruses. 2015. PMID: 26426037 Free PMC article.
-
Unearthing the role of septins in viral infections.Biosci Rep. 2024 Mar 29;44(3):BSR20231827. doi: 10.1042/BSR20231827. Biosci Rep. 2024. PMID: 38372298 Free PMC article. Review.
-
Identification of Genes Whose Expression Profile Is Associated with Non-Progression towards AIDS Using eQTLs.PLoS One. 2015 Sep 14;10(9):e0136989. doi: 10.1371/journal.pone.0136989. eCollection 2015. PLoS One. 2015. PMID: 26367535 Free PMC article.
-
Viral journeys on the intracellular highways.Cell Mol Life Sci. 2018 Oct;75(20):3693-3714. doi: 10.1007/s00018-018-2882-0. Epub 2018 Jul 24. Cell Mol Life Sci. 2018. PMID: 30043139 Free PMC article. Review.
References
Publication types
MeSH terms
Substances
LinkOut - more resources
Full Text Sources
Other Literature Sources
Medical
Research Materials

