

Rapamycin suppresses self-renewal and vasculogenic potential of stem cells isolated from infantile hemangioma
- PMID: 21938011
- PMCID: PMC3213330
- DOI: 10.1038/jid.2011.300
Rapamycin suppresses self-renewal and vasculogenic potential of stem cells isolated from infantile hemangioma
Abstract
Infantile hemangioma (IH) is a common childhood vascular tumor. Although benign, some hemangiomas cause deformation and destruction of features or endanger life. The current treatments, corticosteroid or propranolol, are administered for several months and can have adverse effects on the infant. We designed a high-throughput screen to identify the Food and Drug Administration-approved drugs that could be used to treat this tumor. Rapamycin, an mTOR (mammalian target of Rapamycin) inhibitor, was identified, based on its ability to inhibit proliferation of a hemangioma-derived stem cell population, human vasculogenic cells, which we had previously discovered. In vitro and in vivo studies show that Rapamycin reduces the self-renewal capacity of the hemangioma stem cells, diminishes differentiation potential, and inhibits the vasculogenic activity of these cells in vivo. Longitudinal in vivo imaging of blood flow through vessels formed with hemangioma stem cells shows that Rapamycin also leads to regression of hemangioma blood vessels, consistent with its known anti-angiogenic activity. Finally, we demonstrate that Rapamycin-induced loss of stemness can work in concert with corticosteroid, the current standard therapy for problematic hemangioma, to block hemangioma formation in vivo. Our studies reveal that Rapamycin targets the self-renewal and vascular differentiation potential in patient-derived hemangioma stem cells, and suggests a novel therapeutic strategy to prevent formation of this disfiguring and endangering childhood tumor.
Conflict of interest statement
The authors have no conflicts of interests to declare.
Figures
 ),NHDF (
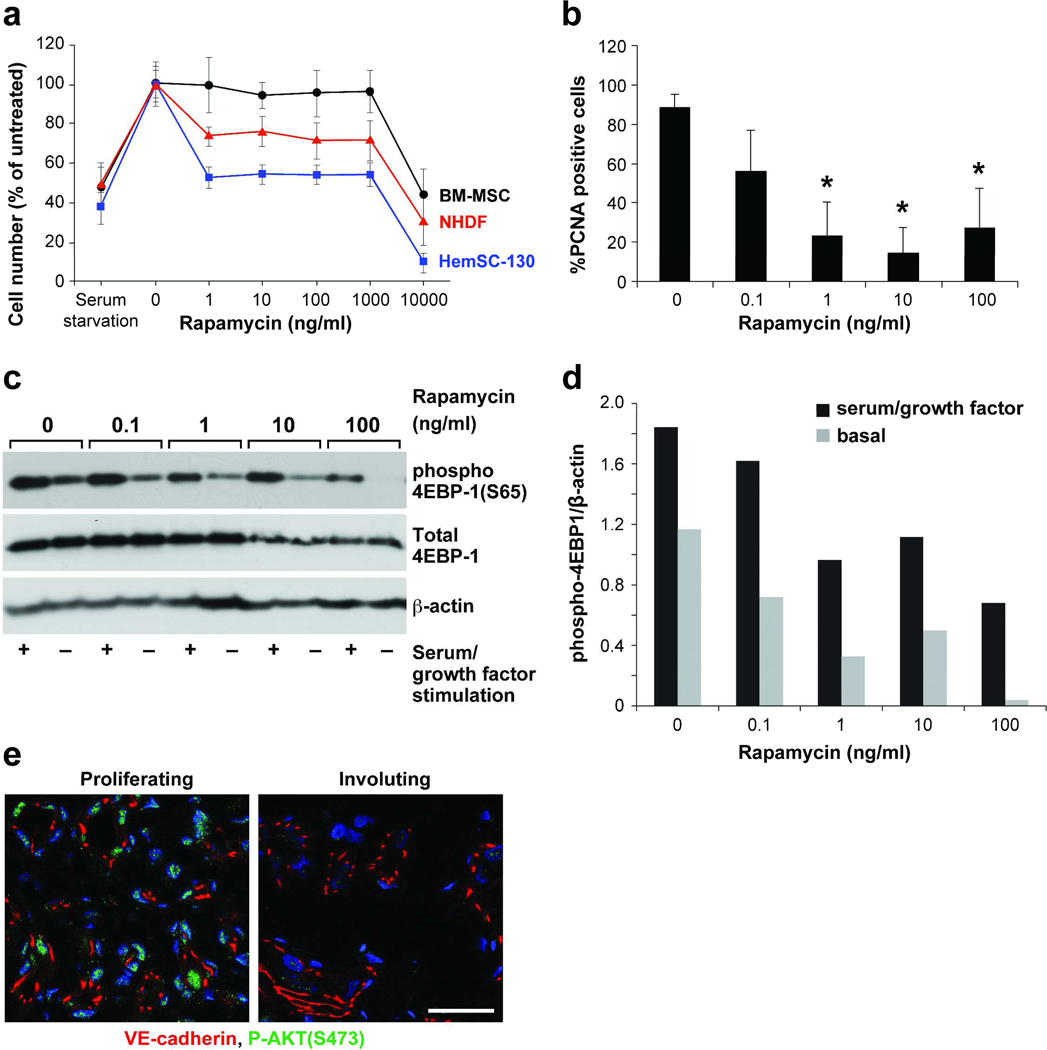
 ) and BM-MSCs (●) treated with Rapamycin. Error bars denote standard deviation (SD) (n = 32). (B) Quantification of PCNA-positive cells in HemSCs treated with Rapamycin. Error bars denote SD (n = 8). *P < .05 compared with the non-treated group. (C) Western blot for phospho4EBP-1(S65) and total 4EBP-1 in HemSCs serum-starved for 24 hours, pretreated with vehicle alone (“0”) or rapamycin for 20 minutes and then stimulated with media containing serum and growth factors for 30 minutes. (D) Bands in C quantified using ImageJ; normalized to β-actin. (E) Immuno-staining for phosphorylated AKT (green) and VE-cadherin (red),

Comment in
-
Infantile hemangioma research: looking backward and forward.J Invest Dermatol. 2011 Dec;131(12):2345-8. doi: 10.1038/jid.2011.315. J Invest Dermatol. 2011. PMID: 22071540
Similar articles
-
Infantile hemangioma research: looking backward and forward.J Invest Dermatol. 2011 Dec;131(12):2345-8. doi: 10.1038/jid.2011.315. J Invest Dermatol. 2011. PMID: 22071540
-
Glucose transporter 1-positive endothelial cells in infantile hemangioma exhibit features of facultative stem cells.Stem Cells. 2015 Jan;33(1):133-45. doi: 10.1002/stem.1841. Stem Cells. 2015. PMID: 25187207 Free PMC article.
-
Inhibition of hemangioma growth using polymer-lipid hybrid nanoparticles for delivery of rapamycin.Biomed Pharmacother. 2017 Nov;95:875-884. doi: 10.1016/j.biopha.2017.08.035. Epub 2017 Sep 10. Biomed Pharmacother. 2017. PMID: 28903183
-
Pharmacologic therapies for infantile hemangioma: is there a rational basis?Plast Reconstr Surg. 2011 Aug;128(2):499-507. doi: 10.1097/PRS.0b013e31821b63a0. Plast Reconstr Surg. 2011. PMID: 21788841 Review.
-
Infantile hemangioma-mechanism(s) of drug action on a vascular tumor.Cold Spring Harb Perspect Med. 2011 Sep;1(1):a006460. doi: 10.1101/cshperspect.a006460. Cold Spring Harb Perspect Med. 2011. PMID: 22229118 Free PMC article. Review.
Cited by
-
Rapamycin reverses paraquat-induced acute lung injury in a rat model through inhibition of NFκB activation.Int J Clin Exp Pathol. 2015 May 1;8(5):4627-38. eCollection 2015. Int J Clin Exp Pathol. 2015. PMID: 26191153 Free PMC article.
-
Adieu to parting Editor in Chief and pioneering scientist Dr. Joyce Bischoff.Angiogenesis. 2021 May;24(2):191-193. doi: 10.1007/s10456-021-09786-6. Angiogenesis. 2021. PMID: 33843032 No abstract available.
-
Rapalogs and mTOR inhibitors as anti-aging therapeutics.J Clin Invest. 2013 Mar;123(3):980-9. doi: 10.1172/JCI64099. Epub 2013 Mar 1. J Clin Invest. 2013. PMID: 23454761 Free PMC article. Review.
-
Pathogenesis of infantile haemangioma.Br J Dermatol. 2013 Jul;169(1):12-9. doi: 10.1111/bjd.12435. Br J Dermatol. 2013. PMID: 23668474 Free PMC article. Review.
-
Reviewing Schwannoma-Hemangioma Composite Tumors With Their Tumorigenetic Molecular Pathways and Associated Syndromic Manifestations.Cureus. 2021 Nov 23;13(11):e19839. doi: 10.7759/cureus.19839. eCollection 2021 Nov. Cureus. 2021. PMID: 34824953 Free PMC article. Review.
References
-
- Amir J, Metzker A, Krikler R, Reisner SH. Strawberry hemangioma in preterm infants. Pediatr Dermatol. 1986;3:331–332. - PubMed
-
- Bennett ML, Fleischer AB, Jr, Chamlin SL, Frieden IJ. Oral corticosteroid use is effective for cutaneous hemangiomas: an evidence-based evaluation. Arch Dermatol. 2001;137:1208–1213. - PubMed
-
- Boon LM, MacDonald DM, Mulliken JB. Complications of systemic corticosteroid therapy for problematic hemangioma. Plast Reconstr Surg. 1999;104:1616–1623. - PubMed
Publication types
MeSH terms
Substances
Grants and funding
LinkOut - more resources
Full Text Sources
Other Literature Sources
Medical
Miscellaneous
