. 2012 Jan 19;119(3):817-25.
doi: 10.1182/blood-2011-06-357384. Epub 2011 Sep 21.

Inducible knockout of GRP78/BiP in the hematopoietic system suppresses Pten-null leukemogenesis and AKT oncogenic signaling

Affiliations

Inducible knockout of GRP78/BiP in the hematopoietic system suppresses Pten-null leukemogenesis and AKT oncogenic signaling

Shiuan Wey et al. Blood. .

Abstract

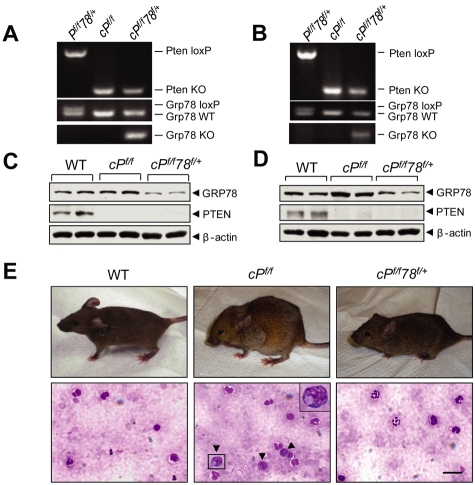
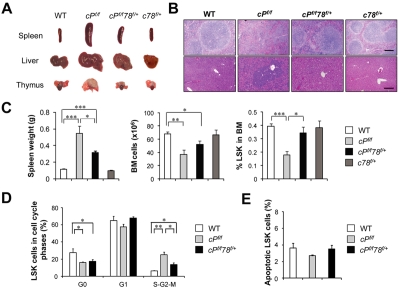
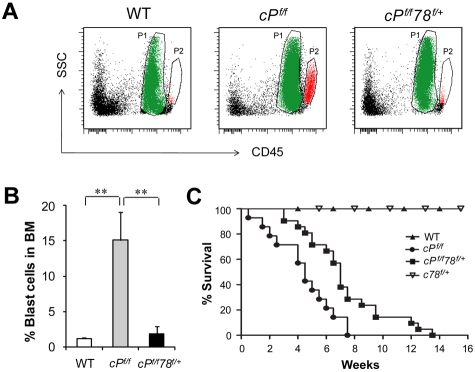
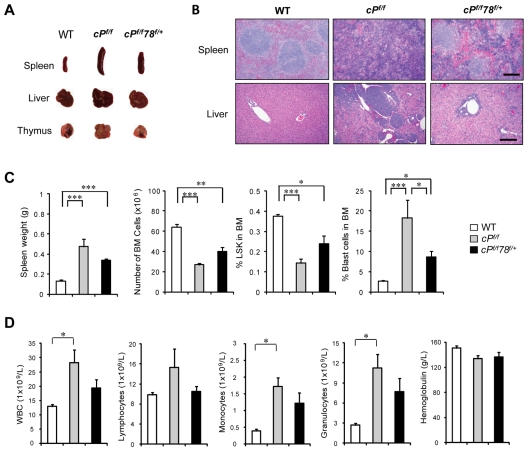
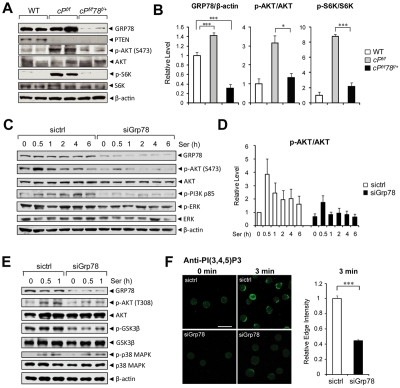
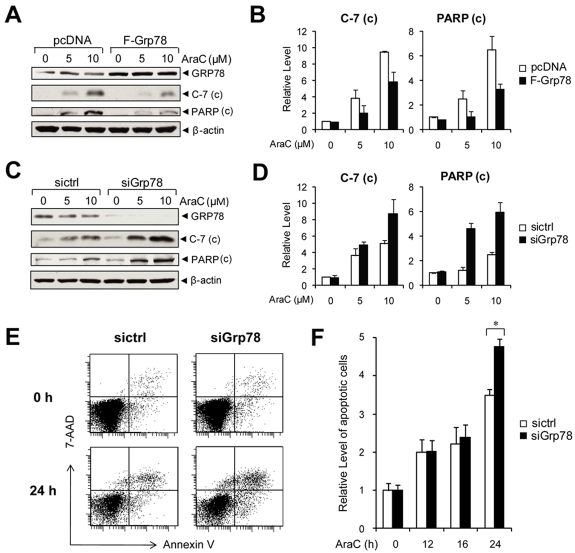
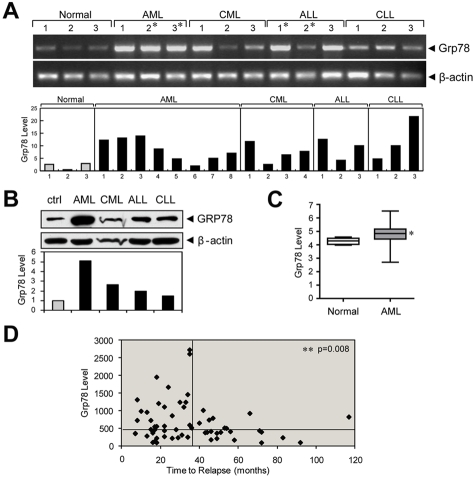
Traditionally, GRP78 is regarded as protective against hypoxia and nutrient starvation prevalent in the microenvironment of solid tumors; thus, its role in the development of hematologic malignancies remains to be determined. To directly elucidate the requirement of GRP78 in leukemogenesis, we created a biallelic conditional knockout mouse model of GRP78 and PTEN in the hematopoietic system. Strikingly, heterozygous knockdown of GRP78 in PTEN null mice is sufficient to restore the hematopoietic stem cell population back to the normal percentage and suppress leukemic blast cell expansion. AKT/mTOR activation in PTEN null BM cells is potently inhibited by Grp78 heterozygosity, corresponding with suppression of the PI3K/AKT pathway by GRP78 knockdown in leukemia cell lines. This is the first demonstration that GRP78 is a critical effector of leukemia progression, at least in part through regulation of oncogenic PI3K/AKT signaling. In agreement with PI3K/AKT as an effector for cytosine arabinoside resistance in acute myeloid leukemia, overexpression of GRP78 renders human leukemic cells more resistant to cytosine arabinoside-induced apoptosis, whereas knockdown of GRP78 sensitizes them. These, coupled with the emerging association of elevated GRP78 expression in leukemic blasts of adult patients and early relapse in childhood leukemia, suggest that GRP78 is a novel therapeutic target for leukemia.


Figures

Figure 1
Figure 1
Grp78 heterozygosity impedes PTEN null-induced leukemogenesis. (A-B) Representative PCR genotyping results from WT (Pf/f78f/+), Pten null (cPf/f) and Pten null, Grp78 heterozygous mice (cPf/f78f/+) BM (A) and splenocytes (B) 6 days after completion of pIpC treatment. (C-D) Western blot results for detection of GRP78 and PTEN protein level in the BM (C) and splenocytes (D) performed in duplicates. (E) Top panel: Hunched posture of PTEN null mice compared with normal posture of WT and cPf/f78f/+ mice. Bottom panel: Detection of immature progenitor cells (dark arrows) in the blood smear of PTEN null mice. A magnified image of one of these cells is shown in the upper right corner. Blood smears were mounted with Pro-Texx mounting medium (Lerner Laboratories, #137635). Images were acquired with a Leica Type DMLB2 microscope (63×/1.4 oil objective) fitted with SPOT RT KE SE Model 7.3 Three Shot Color camera and SPOT 4.0.5 computer software (Diagnostic Instruments Inc). Scale bar represents 30 μm.
Figure 2
Figure 2
Grp78 heterozygosity suppresses PTEN null-mediated MPD characteristics. All analyses were performed 6 days after completion of pIpC treatment. (A) Organ size and morphology from mice of the indicated genotypes. (B) H&E staining of paraffin sections of spleen (top) and liver (bottom) of the indicated genotypes. The scale bar represents 200 μm. Sections of spleen and liver were mounted with Pro-Texx mounting medium (Lerner Laboratories, #137635) and stained with H&E. Images were acquired with a Leica Type DMLB2 microscope (10×/0.3 objective) fitted with SPOT RT KE SE Model 7.3 Three Shot Color camera and SPOT 4.0.5 computer software (Diagnostic Instruments Inc). (C) Quantitation of the spleen weight (n = 8), total BM (BM) cell number (n = 8), and percentage of LSK cells in BM (n = 5) for each indicated genotype. (D) Quantitation of cell cycle distribution of LSK cells from WT (n = 3), cPf/f (n = 5), and cPf/f78f/+ (n = 5). (E) Flow cytometric analysis of apoptotic LSK cells using annexin V and 7-AAD. Data are as mean ± SE. *P < .05 (Student t test). **P < .01 (Student t test). ***P < .001 (Student t test).
Figure 3
Figure 3
Grp78 heterozygosity suppresses PTEN null-mediated blast cell expansion and prolongs survival. (A) Representative results of leukemic blast cell identification. P1 population in green represents the neutrophil region. P2 population in red represents leukemic blast cell region. (B) Quantitation of the leukemic blast cell percentages of WT (n = 7), cPf/f (n = 7), and cPf/f78f/+ (n = 10) shown in panel A. Data are mean ± SE. **P < .01 (Student t test). (C) Kaplan-Meier survival curve of WT (n = 10), Pten null (cPf/f, n = 14), Pten null, Grp78 heterozygous mice (cPf/f78f/+, n = 21), and Grp78 heterozygous mice (c78f/+, n = 5).
Figure 4
Figure 4
Pten null Grp78 heterozygous mice show MPD characteristics after longer latency period. All analyses were performed 21 days after completion of pIpC treatment. (A) Organ size and morphology from mice of the indicated genotypes. (B) H&E staining of paraffin sections of spleen (top) and liver (bottom) of the indicated genotypes. Scale bar represents 200 μm. Sections of spleen and liver were mounted with Pro-Texx mounting medium (Lerner Laboratories, #137635) and stained with H&E. Images were acquired with a Leica Type DMLB2 microscope (10×/0.3 objective) fitted with SPOT RT KE SE Model 7.3 Three Shot Color camera and SPOT 4.0.5 computer software (Diagnostic Instruments Inc). (C) Quantitation of the spleen weight (n = 6), total BM cell number (n = 6), and percentage of LSK cells in BM (n = 5) and percentage blast cells in BM (n = 6) for each indicated genotype. (D) Complete blood count with tail peripheral blood from WT (n = 7), cPf/f (n = 7), and cPf/f78f/+ (n = 7) mice. Peripheral blood was collected via tail bleeding and analyzed using an auto hematology analyzer BC-2800 vet (Mindray) according to the manufacturer's instructions. Data are mean ± SE. *P < .05 (Student t test). **P < .01 (Student t test). ***P < .001 (Student t test).
Figure 5
Figure 5
Knockdown of GRP78 suppresses AKT signaling. (A) Representative Western blot results using BM cell lysates (n = 2 for each genotype) for detection of the indicated protein levels. (B) Quantitation of Western blot results of relative GRP78 level (n = 9 for each genotype) normalized against β-actin and the ratio of p-AKT to total AKT and p-S6K to total S6K in panel A. The ratio of one of the WT levels of GRP78, p-AKT, and p-S6K was set as 1. (C) Western blot results of lysates from HL60 cells transfected with siRNA against Grp78 (siGrp78) or control siRNA (sictrl), followed by serum starvation for 16 hours, and then stimulated with 10% serum for the indicated time (hours). (D) Quantitation of the ratio of p-AKT to total AKT in panel C. The ratio at the 0-hour time point in cells transfected with sictrl was set as 1. (E) Western blot results of lysates from HL60 cells transfected with siRNA against Grp78 (siGrp78) and control siRNA (sictrl), followed by 16-hour serum starvation, and then stimulated with 10% serum for the indicated time (hours). (F) Left: Representative immunofluorescent images of untreated (0 minutes) or serum-stimulated (3 minutes) HL60 cells transfected with either sictrl or siGrp78 and stained with anti–PI(3,4,5)P3 antibody. Scale bar represents 20 μm. Right: Quantification of relative edge fluorescence intensity of PI(3,4,5)P3 staining in serum-stimulated siRNA-transfected cells normalized to nonstimulated siRNA-transfected cells (n ≥ 30 cells per condition). The normalized relative intensity of the 3-minute stimulated sictrl cells was set as 1. Data are mean ± SE. *P < .05 (Student t test). ***P < .001 (Student t test).
Figure 6
Figure 6
Knockdown of GRP78 sensitizes human leukemia cells to AraC. (A) Western blot analysis of NB4 cells transfected with pcDNA or Flag-tagged GRP78 expression vector and then treated with the indicated AraC concentration for 24 hours for detection of cleaved caspase-7 and PARP with β-actin as loading control. (B) Quantitation of cleaved caspase-7 and PARP normalized to β-actin in panel A. The ratio at 0μM AraC in pcDNA cells was set as 1. (C) Western blot analysis of lysates from NB4 cells transfected with siGrp78 or sictrl and treated with the indicated AraC concentration for 24 hours for detection of cleaved caspase-7 and cleaved PARP with β-actin as loading control. (D) Quantitation of cleaved caspase-7 and PARP normalized against β-actin in panel C. The ratio at 0μM AraC in sictrl cells was set as 1. (E) Representative annexin V/7-AAD flow cytometric apoptosis analysis of HL60 cells transfected with control siRNA (sictrl) or siRNA against Grp78 (siGrp78). The cells were either nontreated (0 hours) or treated with 10μM AraC for 24 hours. (F) Time course analysis of apoptotic HL60 cells treated with AraC. HL60 cells were transfected with sictrl or siGrp78, followed by treatment with 10μM AraC for the indicated time (hours). The percentage of apoptotic cells was measured by annexin V/7-AAD flow cytometry. The level of apoptosis at 0 hours in cells treated with sictrl was set as 1. Data are mean ± SE. *P < .05 (Student t test).
Figure 7
Figure 7
Grp78 expression in leukemia and relapse in childhood ALL. (A) Grp78 mRNA levels measured by RT-PCR from peripheral blood or BM (*) samples of the indicated types of leukemia patients, with β-actin levels as control. Below is a summary of Grp78 transcript level in an expanded study after normalization against β-actin. (B) GRP78 protein expression in Ficoll-Paque isolated peripheral blood mononuclear cells of normal control and leukemia patients (AML, CML, ALL, and CLL). Below is the quantitation of the relative GRP78 level normalized against β-actin. (C) Comparison of Grp78 expression between normal BM (n = 5) and AML patient samples (n = 285) using microarray database. (D) Grp78 expression level determined from microarray database of relapse ALL patients (n = 60) was plotted against time to relapse. The horizontal bar represents median Grp78 expression (456) of all ALL patients; and the vertical bar at the 36-month time point separates patients with early relapse (left) and late relapse (right). *P < .05 (Student t test). **P < .01 (Student t test).

Comment in

  • GRPling with PTEN.
    Barber DL. Barber DL. Blood. 2012 Jan 19;119(3):648-9. doi: 10.1182/blood-2011-11-382614. Blood. 2012. PMID: 22262740 No abstract available.

Similar articles

Cited by

References

    1. Maehama T, Dixon JE. The tumor suppressor, PTEN/MMAC1, dephosphorylates the lipid second messenger, phosphatidylinositol 3,4,5-trisphosphate. J Biol Chem. 1998;273(22):13375–13378. - PubMed
    1. Sansal I, Sellers WR. The biology and clinical relevance of the PTEN tumor suppressor pathway. J Clin Oncol. 2004;22(14):2954–2963. - PubMed
    1. Salmena L, Carracedo A, Pandolfi PP. Tenets of PTEN tumor suppression. Cell. 2008;133(3):403–414. - PubMed
    1. Kuhn R, Schwenk F, Aguet M, Rajewsky K. Inducible gene targeting in mice. Science. 1995;269(5229):1427–1429. - PubMed
    1. Lesche R, Groszer M, Gao J, et al. Cre/loxP-mediated inactivation of the murine Pten tumor suppressor gene. Genesis. 2002;32(2):148–149. - PubMed

Publication types

MeSH terms