

Conformational dynamics of single G protein-coupled receptors in solution
- PMID: 21928818
- PMCID: PMC3213290
- DOI: 10.1021/jp204843r
Conformational dynamics of single G protein-coupled receptors in solution
Abstract
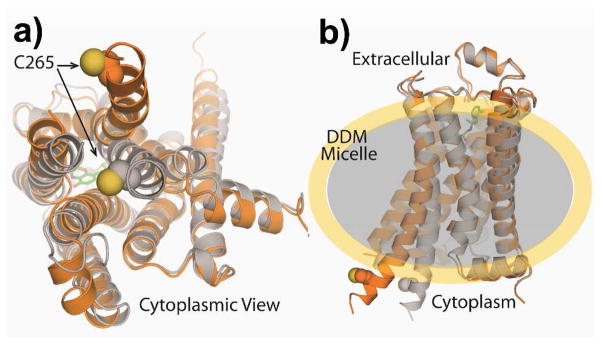
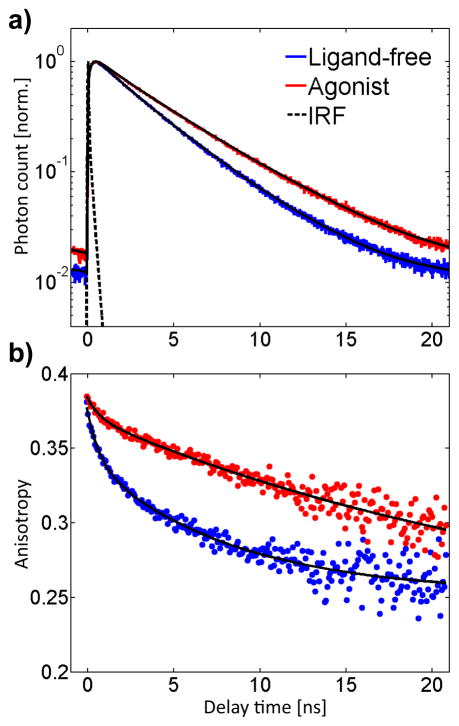
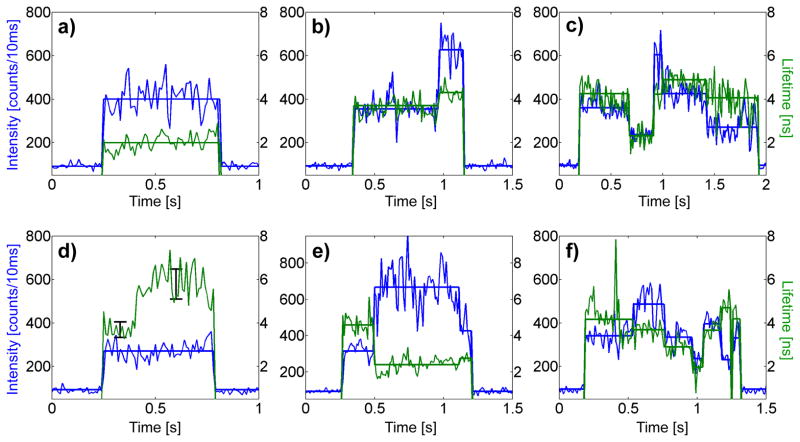
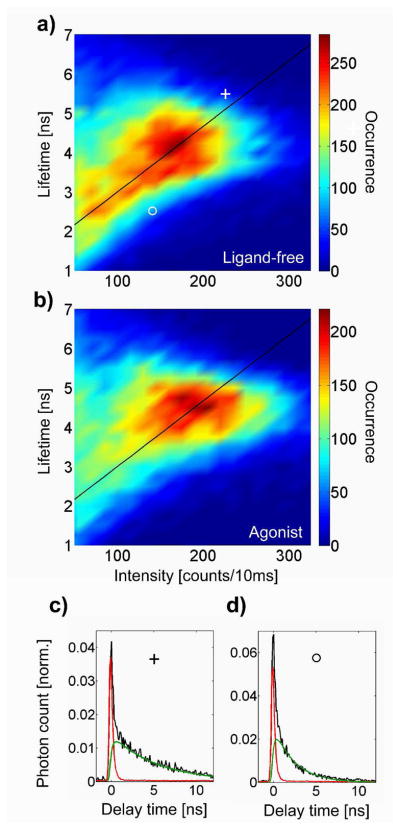
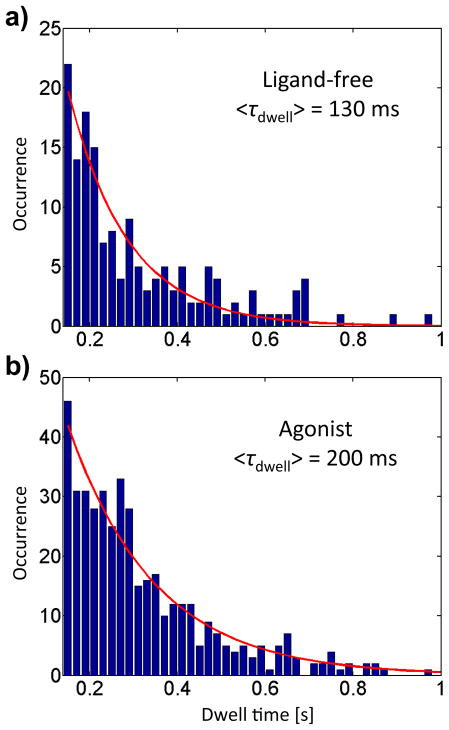
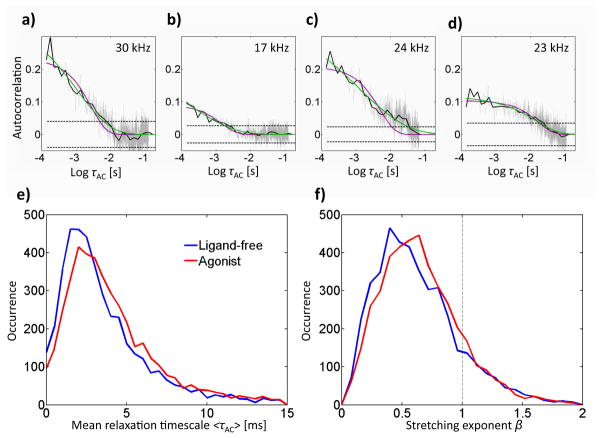
G protein-coupled receptors (GPCRs) comprise a large family of seven-helix transmembrane proteins which regulate cellular signaling by sensing light, ligands, and binding proteins. The GPCR activation process, however, is not a simple on-off switch; current models suggest a complex conformational landscape in which the active, signaling state includes multiple conformations with similar downstream activity. The present study probes the conformational dynamics of single β(2)-adrenergic receptors (β(2)ARs) in the solution phase by Anti-Brownian ELectrokinetic (ABEL) trapping. The ABEL trap uses fast electrokinetic feedback in a microfluidic configuration to allow direct observation of a single fluorescently labeled β(2)AR for hundreds of milliseconds to seconds. By choosing a reporter dye and labeling site sensitive to ligand binding, we observe a diversity of discrete fluorescence intensity and lifetime levels in single β(2)ARs, indicating a varying radiative lifetime and a range of discrete conformational states with dwell times of hundreds of milliseconds. We find that the binding of agonist increases the dwell times of these states, and furthermore, we observe millisecond fluctuations within states. The intensity autocorrelations of these faster fluctuations are well-described by stretched exponential functions with a stretching exponent β ~ 0.5, suggesting protein dynamics over a range of time scales.
Figures
Similar articles
-
Probing single biomolecules in solution using the anti-Brownian electrokinetic (ABEL) trap.Acc Chem Res. 2012 Nov 20;45(11):1955-64. doi: 10.1021/ar200304t. Epub 2012 May 22. Acc Chem Res. 2012. PMID: 22616716 Free PMC article.
-
The dynamic process of β(2)-adrenergic receptor activation.Cell. 2013 Jan 31;152(3):532-42. doi: 10.1016/j.cell.2013.01.008. Cell. 2013. PMID: 23374348 Free PMC article.
-
Agonist-induced conformational changes in bovine rhodopsin: insight into activation of G-protein-coupled receptors.J Mol Biol. 2008 Oct 3;382(2):539-55. doi: 10.1016/j.jmb.2008.06.084. Epub 2008 Jul 7. J Mol Biol. 2008. PMID: 18638482
-
G protein-coupled receptors--recent advances.Acta Biochim Pol. 2012;59(4):515-29. Epub 2012 Dec 18. Acta Biochim Pol. 2012. PMID: 23251911 Free PMC article. Review.
-
Conformational complexity of G-protein-coupled receptors.Trends Pharmacol Sci. 2007 Aug;28(8):397-406. doi: 10.1016/j.tips.2007.06.003. Epub 2007 Jul 13. Trends Pharmacol Sci. 2007. PMID: 17629961 Review.
Cited by
-
Receptor-Ligand Rebinding Kinetics in Confinement.Biophys J. 2019 May 7;116(9):1609-1624. doi: 10.1016/j.bpj.2019.02.033. Epub 2019 Apr 5. Biophys J. 2019. PMID: 31029377 Free PMC article.
-
Stepwise activation of a class C GPCR begins with millisecond dimer rearrangement.Proc Natl Acad Sci U S A. 2019 May 14;116(20):10150-10155. doi: 10.1073/pnas.1900261116. Epub 2019 Apr 25. Proc Natl Acad Sci U S A. 2019. PMID: 31023886 Free PMC article.
-
The regulatory switch of F1-ATPase studied by single-molecule FRET in the ABEL Trap.Proc SPIE Int Soc Opt Eng. 2014 Apr 1;8950:89500H. doi: 10.1117/12.2042688. Proc SPIE Int Soc Opt Eng. 2014. PMID: 25309100 Free PMC article.
-
Single-molecule view of basal activity and activation mechanisms of the G protein-coupled receptor β2AR.Proc Natl Acad Sci U S A. 2015 Nov 17;112(46):14254-9. doi: 10.1073/pnas.1519626112. Epub 2015 Nov 2. Proc Natl Acad Sci U S A. 2015. PMID: 26578769 Free PMC article.
-
Intramolecular fluorescence resonance energy transfer (FRET) sensors of the orexin OX1 and OX2 receptors identify slow kinetics of agonist activation.J Biol Chem. 2012 Apr 27;287(18):14937-49. doi: 10.1074/jbc.M111.334300. Epub 2012 Mar 2. J Biol Chem. 2012. PMID: 22389503 Free PMC article.
References
-
- Pierce KL, Premont RT, Lefkowitz RJ. Seven-Transmembrane Receptors. Nat Rev Mol Cell Biol. 2002;3:639–650. - PubMed
-
- Kenakin T. Efficacy at G-Protein-Coupled Receptors. Nat Rev Drug Discov. 2002;1:103–110. - PubMed
-
- Kenakin TP. Cellular Assays as Portals to Seven-Transmembrane Receptor-Based Drug Discovery. Nat Rev Drug Discov. 2009;8:617–626. - PubMed
-
- Frauenfelder H, Parak F, Young RD. Conformational Substates in Proteins. Annu Rev Biophys Biophys Chem. 1988;17:451–479. - PubMed
Publication types
MeSH terms
Substances
Grants and funding
LinkOut - more resources
Full Text Sources
Research Materials
