Sequential bottlenecks drive viral evolution in early acute hepatitis C virus infection
- PMID: 21912520
- PMCID: PMC3164670
- DOI: 10.1371/journal.ppat.1002243
Sequential bottlenecks drive viral evolution in early acute hepatitis C virus infection
Abstract
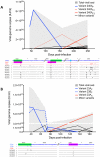
Hepatitis C is a pandemic human RNA virus, which commonly causes chronic infection and liver disease. The characterization of viral populations that successfully initiate infection, and also those that drive progression to chronicity is instrumental for understanding pathogenesis and vaccine design. A comprehensive and longitudinal analysis of the viral population was conducted in four subjects followed from very early acute infection to resolution of disease outcome. By means of next generation sequencing (NGS) and standard cloning/Sanger sequencing, genetic diversity and viral variants were quantified over the course of the infection at frequencies as low as 0.1%. Phylogenetic analysis of reassembled viral variants revealed acute infection was dominated by two sequential bottleneck events, irrespective of subsequent chronicity or clearance. The first bottleneck was associated with transmission, with one to two viral variants successfully establishing infection. The second occurred approximately 100 days post-infection, and was characterized by a decline in viral diversity. In the two subjects who developed chronic infection, this second bottleneck was followed by the emergence of a new viral population, which evolved from the founder variants via a selective sweep with fixation in a small number of mutated sites. The diversity at sites with non-synonymous mutation was higher in predicted cytotoxic T cell epitopes, suggesting immune-driven evolution. These results provide the first detailed analysis of early within-host evolution of HCV, indicating strong selective forces limit viral evolution in the acute phase of infection.
Conflict of interest statement
The authors have declared that no competing interests exist.
Figures


Similar articles
-
Transmitted/Founder Viruses Rapidly Escape from CD8+ T Cell Responses in Acute Hepatitis C Virus Infection.J Virol. 2015 May;89(10):5478-90. doi: 10.1128/JVI.03717-14. Epub 2015 Mar 4. J Virol. 2015. PMID: 25740982 Free PMC article.
-
Characterization of Hepatitis C Virus (HCV) Envelope Diversification from Acute to Chronic Infection within a Sexually Transmitted HCV Cluster by Using Single-Molecule, Real-Time Sequencing.J Virol. 2017 Feb 28;91(6):e02262-16. doi: 10.1128/JVI.02262-16. Print 2017 Mar 15. J Virol. 2017. PMID: 28077634 Free PMC article.
-
Tracking HCV protease population diversity during transmission and susceptibility of founder populations to antiviral therapy.Antiviral Res. 2017 Mar;139:129-137. doi: 10.1016/j.antiviral.2017.01.001. Epub 2017 Jan 3. Antiviral Res. 2017. PMID: 28062191 Free PMC article.
-
Characteristics of the intrahepatic cytotoxic T lymphocyte response in chronic hepatitis C virus infection.Springer Semin Immunopathol. 1997;19(1):69-83. doi: 10.1007/BF00945026. Springer Semin Immunopathol. 1997. PMID: 9266632 Review.
-
Genetic diversity and evolution of hepatitis C virus--15 years on.J Gen Virol. 2004 Nov;85(Pt 11):3173-3188. doi: 10.1099/vir.0.80401-0. J Gen Virol. 2004. PMID: 15483230 Review.
Cited by
-
Applications of next-generation sequencing technologies to diagnostic virology.Int J Mol Sci. 2011;12(11):7861-84. doi: 10.3390/ijms12117861. Epub 2011 Nov 14. Int J Mol Sci. 2011. PMID: 22174638 Free PMC article. Review.
-
Phylogenetic analysis of full-length, early infection, hepatitis C virus genomes among people with intravenous drug use: the InC3 Study.J Viral Hepat. 2017 Jan;24(1):43-52. doi: 10.1111/jvh.12616. Epub 2016 Nov 3. J Viral Hepat. 2017. PMID: 27808453 Free PMC article.
-
Full-Length Envelope Analyzer (FLEA): A tool for longitudinal analysis of viral amplicons.PLoS Comput Biol. 2018 Dec 13;14(12):e1006498. doi: 10.1371/journal.pcbi.1006498. eCollection 2018 Dec. PLoS Comput Biol. 2018. PMID: 30543621 Free PMC article.
-
Estimating viral bottleneck sizes for FMDV transmission within and between hosts and implications for the rate of viral evolution.Interface Focus. 2020 Feb 6;10(1):20190066. doi: 10.1098/rsfs.2019.0066. Epub 2019 Dec 13. Interface Focus. 2020. PMID: 31897294 Free PMC article.
-
Genomic characterization of hepatitis C virus transmitted founder variants with deep sequencing.Infect Genet Evol. 2019 Jul;71:36-41. doi: 10.1016/j.meegid.2019.02.032. Epub 2019 Mar 8. Infect Genet Evol. 2019. PMID: 30853512 Free PMC article.
References
-
- The Global Burden Of Hepatitis CWG. Global burden of disease (GBD) for hepatitis C. J Clin Pharmacol. 2004;44:20–29. - PubMed
-
- Ascione A, Tartaglione T, Di Costanzo GG. Natural history of chronic hepatitis C virus infection. Dig Liv Dis. 2007;39(Suppl 1):S4–7. - PubMed
-
- Bowen D, Walker C. Adaptive immune responses in acute and chronic hepatitis C virus infection. Nature. 2005;436:946–952. - PubMed
-
- Strickland G, El-Kamary S, Klenerman P, Nicosia A. Hepatitis C vaccine: supply and demand. Lancet Infect Dis. 2008;8:379–386. - PubMed
Publication types
MeSH terms
Substances
LinkOut - more resources
Full Text Sources
Medical

