Direct biochemical measurements of signal relay during Dictyostelium development
- PMID: 21911494
- PMCID: PMC3207423
- DOI: 10.1074/jbc.M111.284182
Direct biochemical measurements of signal relay during Dictyostelium development
Abstract
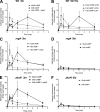
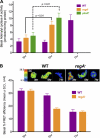
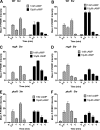
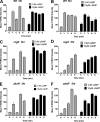
Upon starvation, individual Dictyostelium discoideum cells enter a developmental program that leads to collective migration and the formation of a multicellular organism. The process is mediated by extracellular cAMP binding to the G protein-coupled cAMP receptor 1, which initiates a signaling cascade leading to the activation of adenylyl cyclase A (ACA), the synthesis and secretion of additional cAMP, and an autocrine and paracrine activation loop. The release of cAMP allows neighboring cells to polarize and migrate directionally and form characteristic chains of cells called streams. We now report that cAMP relay can be measured biochemically by assessing ACA, ERK2, and TORC2 activities at successive time points in development after stimulating cells with subsaturating concentrations of cAMP. We also find that the activation profiles of ACA, ERK2, and TORC2 change in the course of development, with later developed cells showing a loss of sensitivity to the relayed signal. We examined mutants in PKA activity that have been associated with precocious development and find that this loss in responsiveness occurs earlier in these mutants. Remarkably, we show that this loss in sensitivity correlates with a switch in migration patterns as cells transition from streams to aggregates. We propose that as cells proceed through development, the cAMP-induced desensitization and down-regulation of cAMP receptor 1 impacts the sensitivities of chemotactic signaling cascades leading to changes in migration patterns.
Figures


Similar articles
-
A new HECT ubiquitin ligase regulating chemotaxis and development in Dictyostelium discoideum.J Cell Sci. 2017 Feb 1;130(3):551-562. doi: 10.1242/jcs.194225. Epub 2017 Jan 3. J Cell Sci. 2017. PMID: 28049717
-
A novel Ras-interacting protein required for chemotaxis and cyclic adenosine monophosphate signal relay in Dictyostelium.Mol Biol Cell. 1999 Sep;10(9):2829-45. doi: 10.1091/mbc.10.9.2829. Mol Biol Cell. 1999. PMID: 10473630 Free PMC article.
-
A molecular network that produces spontaneous oscillations in excitable cells of Dictyostelium.Mol Biol Cell. 1998 Dec;9(12):3521-32. doi: 10.1091/mbc.9.12.3521. Mol Biol Cell. 1998. PMID: 9843585 Free PMC article.
-
Transduction of the chemotactic cAMP signal across the plasma membrane of Dictyostelium cells.Experientia. 1995 Dec 18;51(12):1144-54. doi: 10.1007/BF01944732. Experientia. 1995. PMID: 8536802 Review.
-
Follow the leader.Dev Cell. 2003 Mar;4(3):291-3. doi: 10.1016/s1534-5807(03)00064-9. Dev Cell. 2003. PMID: 12636911 Review.
Cited by
-
LTB4 is a signal-relay molecule during neutrophil chemotaxis.Dev Cell. 2012 May 15;22(5):1079-91. doi: 10.1016/j.devcel.2012.02.003. Epub 2012 Apr 26. Dev Cell. 2012. PMID: 22542839 Free PMC article.
-
Loss of the histidine kinase DhkD results in mobile mounds during development of Dictyostelium discoideum.PLoS One. 2013 Sep 25;8(9):e75618. doi: 10.1371/journal.pone.0075618. eCollection 2013. PLoS One. 2013. PMID: 24086589 Free PMC article.
-
Aberrant adhesion impacts early development in a Dictyostelium model for juvenile neuronal ceroid lipofuscinosis.Cell Adh Migr. 2017 Jul 4;11(4):399-418. doi: 10.1080/19336918.2016.1236179. Epub 2016 Sep 26. Cell Adh Migr. 2017. PMID: 27669405 Free PMC article.
-
Modeling and measuring signal relay in noisy directed migration of cell groups.PLoS Comput Biol. 2013;9(5):e1003041. doi: 10.1371/journal.pcbi.1003041. Epub 2013 May 2. PLoS Comput Biol. 2013. PMID: 23658506 Free PMC article.
-
Diverse and dynamic sources and sinks in gradient formation and directed migration.Curr Opin Cell Biol. 2014 Oct;30:91-8. doi: 10.1016/j.ceb.2014.06.009. Epub 2014 Jul 12. Curr Opin Cell Biol. 2014. PMID: 25022255 Free PMC article. Review.
References
-
- Weijer C. J. (2009) J. Cell Sci. 122, 3215–3223 - PubMed
Publication types
MeSH terms
Substances
Grants and funding
LinkOut - more resources
Full Text Sources
Miscellaneous

