. 2012 Jan;40(1):102-15.
doi: 10.1093/nar/gkr637. Epub 2011 Sep 12.

Epigenetic regulation by RARα maintains ligand-independent transcriptional activity

Affiliations

Epigenetic regulation by RARα maintains ligand-independent transcriptional activity

Kristian B Laursen et al. Nucleic Acids Res. 2012 Jan.

Abstract

Retinoic acid receptors (RARs) α, β and γ are key regulators of embryonic development. Hematopoietic differentiation is regulated by RARα, and several types of leukemia show aberrant RARα activity. Through microarray expression analysis, we identified transcripts differentially expressed between F9 wild-type (Wt) and RARα knockout cells cultured in the absence or presence of the RAR-specific ligand all trans retinoic acid (RA). We validated the decreased Mest, Tex13, Gab1, Bcl11a, Tcfap2a and HMGcs1 transcript levels, and increased Slc38a4, Stmn2, RpL39l, Ref2L, Mobp and Rlf1 transcript levels in the RARa knockout cells. The decreased Mest and Tex13 transcript levels were associated with increased promoter CpG-island methylation and increased repressive histone modifications (H3K9me3) in RARα knockout cells. Increased Slc38a4 and Stmn2 transcript levels were associated with decreased promoter CpG-island methylation and increased permissive histone modifications (H3K9/K14ac, H3K4me3) in RARα knockout cells. We demonstrated specific association of RARα and RXRα with the Mest promoter. Importantly, stable expression of a dominant negative, oncogenic PML-RARα fusion protein in F9 Wt cells recapitulated the decreased Mest transcript levels observed in RARα knockout cells. We propose that RARα plays an important role in cellular memory and imprinting by regulating the CpG methylation status of specific promoter regions.


Figures

Figure 1.
Figure 1.
Gene expression analyses of wild-type and RARα knockout cells. Relative transcript levels were identified by microarray analysis and the genes differentially expressed (2-fold or more difference in transcript levels between wild-type and RARα knockout cells) were plotted as fold difference in presence of RA against the fold difference in vehicle-treated cells (A right panel, transcript levels in RARα−/− cells >2-fold transcript levels in Wt cells; C left panel, transcript levels in RARα−/− cells <0.5-fold transcript levels in Wt cells). Selected genes with increased transcript levels in RARα−/− cells (Slc38a4 and Stmn2) and with decreased transcript levels in RARα−/− cells (Mest and Tex13) were validated by real-time PCR (A left panel and C right panel, respectively) to be differentially expressed between Wt and RARα−/− cells in a ligand-independent manner (measured in arbitrary units correlated with 36B4 expression, note the logarithmic scale). The duration of the RA treatment is indicated by the bar color (0 h; gray, 8 h; light gray, and 24 h; dark gray). Additional genes were validated by semi-quantitative PCR to be differentially expressed between Wt and RARα−/− cells in a ligand-independent manner. Genes with increased transcript levels (B) and genes decreased transcript levels (D). Different time points of RA treatment are indicated by the bar color (0 h; gray, and 24 h; dark gray). The specific bands (white arrowheads) and the relative transcript levels (bars above gels) are indicated. Assessment of household gene (36B4 and HPRT1) transcript levels confirmed similar amounts of cDNA in all samples (data not shown). (E) Transcript levels of RA inducible genes (Cyp26a1, Hoxa5, Hoxb5 and Hoxb2) assessed by real-time PCR at 0, 8 and 24 h of RA treatment of Wt and RARα−/− cells (correlated with 36B4 transcript levels). Each graph is a compilation of three independent biological replicates. (F) Western blot validation of the RARα knockout cell line. A band of the expected size is detected by an RARα specific antibody in Wt, but not in the RARα−/− cell line (left). In lysates from transfected COS cells RARα, but not RARβ or RARγ, is detected by the Ab (Santa Cruz, sc-551). The data represent three independent assays (microarray and real-time PCR), harvesting new RNA for each experiment, or a representative assay out of at least three independent assays (semi-quantitative PCR and western blot).
Figure 2.
Figure 2.
The Epigenetic Signatures of Mest, Tex13, Stmn2 and Slc38a4 promoter regions. (A) Mest and Tex13 promoters displayed increased methylation in RARα−/− relative to Wt cells. In contrast, Slc38a4 and Stmn2 displayed decreased methylation in RARα−/− relative to Wt cells. Each horizontal line represents the methylation status of an independent allele. The numbers below the figures indicate the CpG position relative to the transcriptional start site (+1). (B–D) Promoter specific ChIP were quantified by real-time PCR on chromatin IPed from Wt and from RARα knockout cells treated with vehicle or RA (vehicle—0 h; gray and RA—24 h; dark gray bars). (B) Histone modification in F9 Wt and RARα−/− cells. H3K9/14ac modifications (upper panel). In RARα−/− cells H3K9/K14ac levels at the Mest and Tex13 promoters is decreased, while levels at the Stmn2 and Slc38a4 promoters is increased relative to Wt. (C) H3K9me3 modifications (middle panel). In RARα−/− cells the H3K9me3 level at the Mest promoter is increased, while the level at the Slc38a4 promoter is decreased. H3K9me3 levels at the Tex13 and Stmn2 promoters are not significantly changed in RARα−/− cells. A low signal (15- to 30-fold above the IgG) for H3K9me3 is seen at the Cyp26a1 promoter. (D) H3K4me3 modifications (lower panel). In RARα−/− cells H3K4me3 levels at the Mest and Tex13 promoters are decreased, whereas the levels at the Stmn2 and Slc38a4 promoters are increased relative to Wt. The signal from the IgG IP was set to 1 for each PCR. The data represent three independent IPs for each Ab, harvesting new chromatin for each IP. Statistical significance is demonstrated by P-values below 0.05 for the indicated comparisons. (C) Mest proximal promoter region. The promoter (excluding the sequences in italics) was evaluated for CpG methylation (bold). Underlined sequences indicate putative elements: RARE (DR1), NFkB-binding site, TATA box (TATA), transcriptional start site (TSS) and the exact region targeted by ChIP primers (labels to the right).
Figure 3.
Figure 3.
RARα and RXRα binding to target promoters. Promoter specific ChIP were quantified by real-time PCR on chromatin IPed from Wt and from RARα−/− cells treated with vehicle or RA (vehicle–0 h; gray and RA–24 h; dark gray bars). The chromatin was IPed using (A) an RARα Ab, (B) an RXRα Ab or (C) IgG negative control. The western blot in Figure 1f demonstrates antibody specificity toward RARα. The average signal from IgG IP was set to 1 (marked by the light gray background in A, B and C). The data represent four independent IPs for each Ab, harvesting new chromatin for each IP. Statistical significance is demonstrated by P < 0.05 for the indicated comparisons.
Figure 4.
Figure 4.
Ectopic RARα expression affects Mest transcript levels in F9 cells. (A) Full-length RARα2 was stably expressed in F9 RARα−/− cells (upper right). Transcript levels assessed by real-time PCR demonstrate partial restoration of Mest transcript levels (upper left), but no reversal of the overall promoter methylation (lower left). Stmn2 transcript levels were not affected (middle panel). Tex13 and Slc38a4 transcript levels were inconsistent between the two independent RARα2 restoration lines (lower middle and right panel). The P-values show a comparison of RARα2 restoration cell lines to the RARα knockout cell line. The data represent three independent assays, harvesting new RNA for each experiment. (B) The PML–RARα oncogene was stably expressed in F9 Wt cells. Transcript levels assessed by real-time PCR (upper left panel) suggest a dominant negative function of the PML–RARα protein for Mest associated with increased levels of promoter methylation (lower left panel), while Tex13, Slc38a4 and Stmn2 transcript levels were not affected (Wt, 24 h RA was set to 1). RA induced transcription of Cyp26a1 was impaired in PML–RARα expressing cells (upper right panel). The duration of the RA treatment is indicated by the bar color (0 h; gray, 8 h; light gray, and 24 h; dark gray bars). The P-values show a comparison of the PML–RARα cell line to the F9 Wt cells. The data represent three independent assays, harvesting new RNA for each experiment.
Figure 5.
Figure 5.
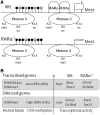
Model for RARα dependent epigenetic regulation. (A) Ligand-independent binding of RARα/RXRα heterodimers to the Mest promoter region is required to maintain transcriptionally permissive histone modifications (H3K4me3 and H3K9/K14ac) and relatively low methylation levels of promoter CpG islands (upper panel). Knockout of RARα results in higher levels of Mest promoter methylation, loss of permissive histone modifications, and gain of repressive histone modifications (lower panel). (B) Actively transcribed genes display relative low levels of promoter methylation and high levels of H3K9/K14ac and H3K4me3 (Mest and Tex13 in Wt, Stmn2 and Slc38a4 in RARα−/−), whereas silenced genes display high levels of promoter methylation and, if paternally expressed, high H3K9me3 levels (Slc38a4 in Wt, Mest in RARα−/−). Transcriptional start sites (TSS) and relative transcriptional activities are indicated by the arrows and arrow sizes, respectively. The relative levels of CpG promoter methylation are denoted by black lollipops (the CpG-rich regions assessed each span the TSS but for clarity are drawn upstream of the TSS).

Similar articles

Cited by

References

    1. Collins SJ. The role of retinoids and retinoic acid receptors in normal hematopoiesis. Leukemia. 2002;16:1896–1905. - PubMed
    1. de The H, Lavau C, Marchio A, Chomienne C, Degos L, Dejean A. The PML-RAR alpha fusion mRNA generated by the t(15;17) translocation in acute promyelocytic leukemia encodes a functionally altered RAR. Cell. 1991;66:675–684. - PubMed
    1. Leroy P, Krust A, Zelent A, Mendelsohn C, Garnier JM, Kastner P, Dierich A, Chambon P. Multiple isoforms of the mouse retinoic acid receptor alpha are generated by alternative splicing and differential induction by retinoic acid. EMBO J. 1991;10:59–69. - PMC - PubMed
    1. Chen Z, Guidez F, Rousselot P, Agadir A, Chen SJ, Wang ZY, Degos L, Zelent A, Waxman S, Chomienne C. PLZF-RAR alpha fusion proteins generated from the variant t(11;17)(q23;q21) translocation in acute promyelocytic leukemia inhibit ligand-dependent transactivation of wild-type retinoic acid receptors. Proc. Natl Acad. Sci. USA. 1994;91:1178–1182. - PMC - PubMed
    1. Qiu J, Huang Y, Chen G, Chen Z, Tweardy DJ, Dong S. Aberrant chromatin remodeling by retinoic acid receptor alpha fusion proteins assessed at the single-cell level. Mol. Biol. Cell. 2007;18:3941–3951. - PMC - PubMed

Publication types

MeSH terms

Associated data