. 2011 Sep;23(9):3215-29.
doi: 10.1105/tpc.111.088492. Epub 2011 Sep 6.

A wheat homolog of MOTHER OF FT AND TFL1 acts in the regulation of germination

Affiliations

A wheat homolog of MOTHER OF FT AND TFL1 acts in the regulation of germination

Shingo Nakamura et al. Plant Cell. 2011 Sep.

Abstract

Seed dormancy is an adaptive mechanism and an important agronomic trait. Temperature during seed development strongly affects seed dormancy in wheat (Triticum aestivum) with lower temperatures producing higher levels of seed dormancy. To identify genes important for seed dormancy, we used a wheat microarray to analyze gene expression in embryos from mature seeds grown at lower and higher temperatures. We found that a wheat homolog of MOTHER OF FT AND TFL1 (MFT) was upregulated after physiological maturity in dormant seeds grown at the lower temperature. In situ hybridization analysis indicated that MFT was exclusively expressed in the scutellum and coleorhiza. Mapping analysis showed that MFT on chromosome 3A (MFT-3A) colocalized with the seed dormancy quantitative trait locus (QTL) QPhs.ocs-3A.1. MFT-3A expression levels in a dormant cultivar used for the detection of the QTL were higher after physiological maturity; this increased expression correlated with a single nucleotide polymorphism in the promoter region. In a complementation analysis, high levels of MFT expression were correlated with a low germination index in T1 seeds. Furthermore, precocious germination of isolated immature embryos was suppressed by transient introduction of MFT driven by the maize (Zea mays) ubiquitin promoter. Taken together, these results suggest that MFT plays an important role in the regulation of germination in wheat.


Figures
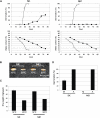
Figure 1.
Figure 1.
The Developmental Status of Seeds for Microarray Analysis. (A) Time course of germination percentages and water content during seed development. Wheat cultivars SK and N61 were grown at 13 or 25°C after anthesis. Results from triplicate independent biological samples (n = 3) are shown as lines with closed circles (grown at 13°C) and open squares (grown at 25°C). Error bars represent sd. (B) Mature seeds grown at 13 or 25°C. N61 seeds are mature at DAA76 grown at 13°C or at DAA34 grown at 25°C, and SK seeds are mature at DAA80 grown at 13°C or at DAA 38 grown at 25°C. (C) Average dry weight of mature seeds grown at 13 or 25°C. Results from triplicate independent biological samples (n = 3) are shown; error bars represent sd. (D) Germination percentages of after-ripened mature seeds grown at 13°C. M, the mature seeds grown at 13°C during seed development. A, the after-ripened seeds: the mature seeds grown at 13°C stored for 6 months at 4°C. After-ripened 30 seeds were incubated for 5 d at 15°C. Results from triplicate independent biological samples (n = 3) are shown, and error bars represent sd. The germination percentages of the after-ripened seeds in SK and N61 were 100% in the triplicate repeats.
Figure 2.
Figure 2.
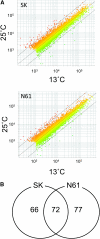
The Results of Microarray Analysis. (A) Scatterplots illustrating the distributions of the microarray signal intensities. Wheat cultivars SK and N61 grown at 13 and 25°C after anthesis. Average signal intensities of three biological replicates are shown. There are 10,762 genes in SK and 10,453 genes in N61 that showed signal intensity of >1000 in either the 13 or 25°C samples and no flags (marks of microarray spots that have bad quality evaluated by Feature Extraction software). The diagonal black line in the middle of the points represents 1:1 signal ratio (no change), and the flanking lines on either side represent a threefold change. (B) A Venn diagram of differentially expressed genes in SK and N61. The numbers of genes with the control or raw signal intensity >1000, fold change >2, and q-value <0.05 (average of three biological replicates) are shown.
Figure 3.
Figure 3.
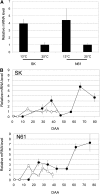
The Temperature Effect on the Expression of MFT. (A) MFT expression levels in mature embryos. Wheat cultivars SK and N61 grown at 13 and 25°C after anthesis. qRT-PCR was performed. Mature seeds grown at 13°C were isolated at DAA80 in SK and at DAA76 in N61. Mature seeds grown at 25°C were isolated at DAA43 in SK and at DAA39 in N61. The relative mRNA levels at 25°C were set at a standard value of 1. Transcript levels were normalized using the actin gene as an internal control. Results from quintuple independent biological samples (n = 5) are shown, and error bars represent sd. (B) Time course of MFT expression levels during seed development in SK and N61. qRT-PCR was performed with triplicate technical samples (n = 3), and equivalent results were obtained using duplicate independent biological samples. The error bars represent sd. Transcript levels were normalized using the actin gene as an internal control. In SK, the relative mRNA level at 25°C at DAA43 was set at a standard value of 1. In N61, the relative mRNA level at 25°C at DAA39 was set at a standard value of 1. Closed circles, grown at 13°C; open squares, grown at 25°C.
Figure 4.
Figure 4.
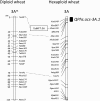
Genetic Map of Diploid and Hexaploid Wheat MFT Homologs. In the diploid wheat genetic map, the marker order is shown on the right, with genetic distances (centimorgan [cM] scale) on the left. Tm-MFT: diploid wheat MFT homolog (see Supplemental Figure 4 online). In the hexaploid wheat genetic map, the marker order is shown on the left, with the location of seed dormancy QTL QPhs.ocs-3A.1 indicated on the right by a black rectangle. The construction of the hexaploid wheat genetic map using 125 RILs derived from a cross between Zen and CS was described previously by Mori et al. (2005). The locations of homologous genes and markers between diploid and hexaploid wheat are connected with dashed lines.
Figure 5.
Figure 5.
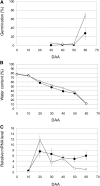
Time Course of MFT Expression during Seed Development in CS and CS(Zen3A). Results from triplicate independent biological samples (n = 3) are shown as lines with closed circles for CS(Zen3A) and open squares for CS. Error bars represent sd. (A) Time course of germination percentages. (B) Time course of seed water content. (C) Time course of the expression levels of MFT. Total RNA was isolated from whole seeds (DAA10) or embryos (DAA20 to 60) at the indicated DAA. Transcript levels were normalized using the actin gene as an internal control. The relative mRNA level of CS at DAA60 was set at a standard value of 1.
Figure 6.
Figure 6.
Localization of MFT Transcripts in Immature Embryos by in Situ Hybridization. Longitudinal sections of the embryos of CS at 21 DAA were probed with antisense or sense RNA. Positive hybridization signals are visible as a blue color in the scutellum and coleorhiza tissues. a, embryo; b, scutellum; c, coleorhiza; d, endosperm.
Figure 7.
Figure 7.
Comparison of the CS and Zen MFT-3A Genomic Sequences. The red arrows indicate two loci in the genomic sequence of MFT-3A that differ between Zen and CS. The red bold nucleotides show polymorphism. ATG, initiation codon; TGA, stop codon; CS, less dormant wheat cultivar Chinese Spring; Zen, dormant wheat cultivar Zenkoujikomugi; Tx7, seven repeats of T; Gx14, 14 repeats of G.
Figure 8.
Figure 8.
Correlation between MFT Expression Level and Germination Index in T1 Seeds. MFT mRNA levels and germination index were measured using T1 seeds from the same spikes of 26 independent T0 plants (n = 26) that were produced by transforming CS with the entire genomic sequence of Zen MFT3A. The MFT expression level was measured using qRT-PCR. Total RNA was extracted from embryos of 30 seeds. The expression level was normalized to the level of MFT of CS at DAA60 (Figure 5C), which was set as 1. The germination index was measured using 16 or 24 seeds incubated at 20°C for 7 d.
Figure 9.
Figure 9.
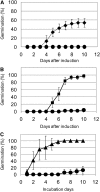
Time Course of the Germination Percentage in the Transient MFT Expression Assay. (A) Time course of the germination percentage after transformation with Ubi:TaMFT (closed circles) or Ubi:GUS (closed diamonds). Wheat cultivar CS was used. Results from triplicate independent biological samples (n = 3) are shown, and error bars represent sd. Equivalent results were obtained in triplicate repeats of triplicate independent biological samples. (B) Time course of germination percentage after transformation with Ubi:TaMFT (closed circles) or Ubi:TaMFT(Stop) (closed squares). Wheat cultivar Bobwhite (BW) was used. Results from triplicate independent biological samples (n = 3) are shown, and error bars represent sd. Equivalent results were obtained in triplicate repeats of triplicate independent biological samples. (C) Time course of germination percentage after transferring the ungerminated embryos with Ubi:TaMFT onto medium with or without GA. The isolated immature embryos cultured for 10 d after induction of Ubi:TaMFT did not germinate. Subsequently, they were transferred and cultured for 10 d on medium with (closed triangles) or without (closed circles) 1 μM GA. Results from triplicate independent biological samples (n = 3) are shown, and error bars represent sd. Equivalent results were obtained in triplicate repeats of triplicate independent biological samples.
Figure 10.
Figure 10.
Time Course of Isolated CS Immature Embryo Development after Transformation with Ubi:TaMFT or Ubi:GUS. h, hours after transformation; d, days after transformation. Bar = 2 mm.
Figure 11.
Figure 11.
Time Course of MFT Expression after Transformation with Ubi:TaMFT or Ubi:TaMFT(Stop). The expression level of MFT was analyzed by qRT-PCR using isolated immature embryos of Bobwhite (BW) cultured for 1, 2, and 4 d after transformation with Ubi:TaMFT or Ubi:TaMFT(Stop). Closed circles, Ubi:TaMFT; closed squares, Ubi:TaMFT(Stop); closed triangles, untransfomed, isolated immature embryos simply placed on the medium. Results from triplicate independent biological samples (n = 3) are shown, and error bars represent sd. The expression level was normalized to the level of MFT of CS at DAA60 (Figure 5C), which was set as 1.

Similar articles

Cited by

References

    1. Abe M., Kobayashi Y., Yamamoto S., Daimon Y., Yamaguchi A., Ikeda Y., Ichinoki H., Notaguchi M., Goto K., Araki T. (2005). FD, a bZIP protein mediating signals from the floral pathway integrator FT at the shoot apex. Science 309: 1052–1056 - PubMed
    1. Allouis S., Moore G., Bellec A., Sharp R., Faivre-Rampant P., Mortimer K., Pateyron S., Foote T.N., Griffiths S., Caboche M., Chaloub B. (2003). Construction and characterization of a hexaploid wheat BAC library from the reference germplasm ‘Chinese Spring’. Cereal Res. Commun. 31: 331–338
    1. Altschul S.F., Gish W., Miller W., Myers E.W., Lipman D.J. (1990). Basic local alignment search tool. J. Mol. Biol. 215: 403–410 - PubMed
    1. Appleford N.E.J., Lenton J.R. (1997). Hormonal regulation of -amylase gene expression in germinating wheat (Triticum aestivum) grains. Physiol. Plant. 100: 534–542
    1. Ashikawa I., Abe F., Nakamura S. (2010). Ectopic expression of wheat and barley DOG1-like genes promotes seed dormancy in Arabidopsis. Plant Sci. 179: 536–542 - PubMed

Publication types

MeSH terms