

Novel dimeric structure of phage φ29-encoded protein p56: insights into uracil-DNA glycosylase inhibition
- PMID: 21890898
- PMCID: PMC3239192
- DOI: 10.1093/nar/gkr667
Novel dimeric structure of phage φ29-encoded protein p56: insights into uracil-DNA glycosylase inhibition
Abstract
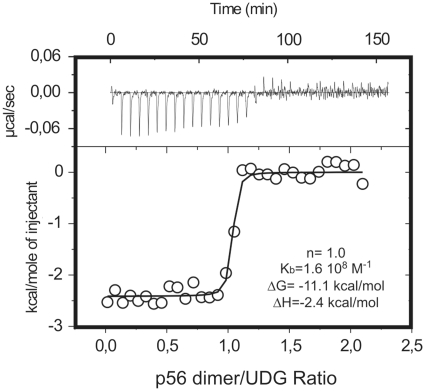
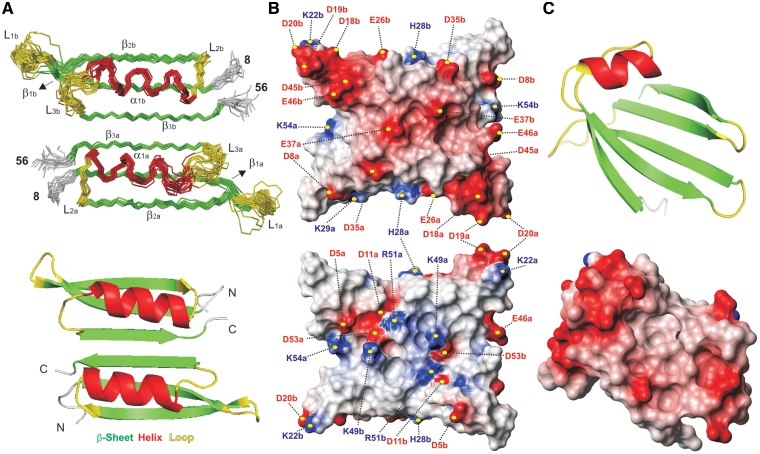
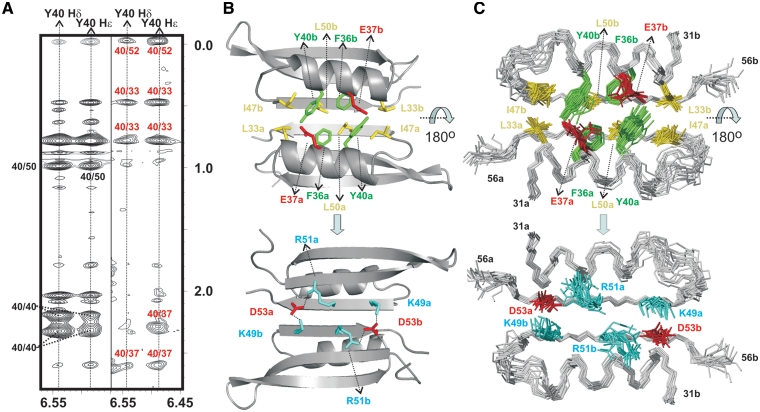
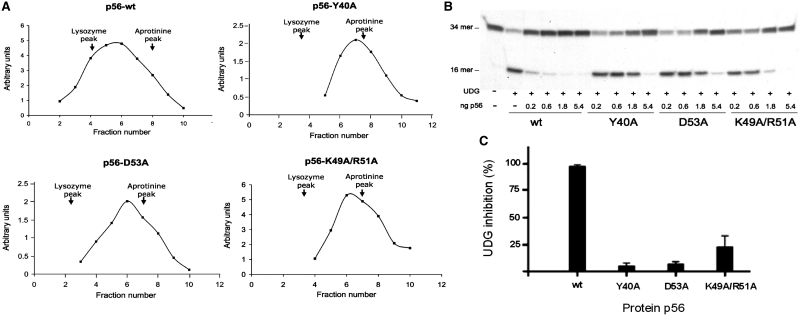
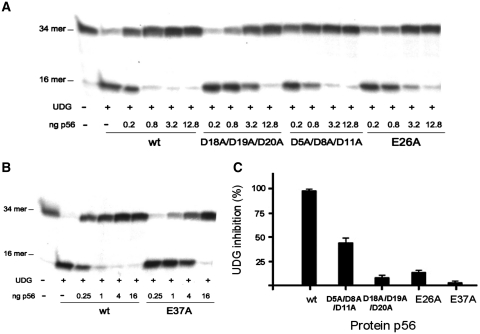
Protein p56 encoded by the Bacillus subtilis phage φ29 inhibits the host uracil-DNA glycosylase (UDG) activity. To get insights into the structural basis for this inhibition, the NMR solution structure of p56 has been determined. The inhibitor defines a novel dimeric fold, stabilized by a combination of polar and extensive hydrophobic interactions. Each polypeptide chain contains three stretches of anti-parallel β-sheets and a helical region linked by three short loops. In addition, microcalorimetry titration experiments showed that it forms a tight 2:1 complex with UDG, strongly suggesting that the dimer represents the functional form of the inhibitor. This was further confirmed by the functional analysis of p56 mutants unable to assemble into dimers. We have also shown that the highly anionic region of the inhibitor plays a significant role in the inhibition of UDG. Thus, based on these findings and taking into account previous results that revealed similarities between the association mode of p56 and the phage PBS-1/PBS-2-encoded inhibitor Ugi with UDG, we propose that protein p56 might inhibit the enzyme by mimicking its DNA substrate.
© The Author(s) 2011. Published by Oxford University Press.
Figures
Similar articles
-
Crystal structure and functional insights into uracil-DNA glycosylase inhibition by phage Φ29 DNA mimic protein p56.Nucleic Acids Res. 2013 Jul;41(13):6761-73. doi: 10.1093/nar/gkt395. Epub 2013 May 13. Nucleic Acids Res. 2013. PMID: 23671337 Free PMC article.
-
Protein p56 from the Bacillus subtilis phage phi29 inhibits DNA-binding ability of uracil-DNA glycosylase.Nucleic Acids Res. 2007;35(16):5393-401. doi: 10.1093/nar/gkm584. Epub 2007 Aug 13. Nucleic Acids Res. 2007. PMID: 17698500 Free PMC article.
-
Characterization of Bacillus subtilis uracil-DNA glycosylase and its inhibition by phage φ29 protein p56.Mol Microbiol. 2011 Jun;80(6):1657-66. doi: 10.1111/j.1365-2958.2011.07675.x. Epub 2011 May 12. Mol Microbiol. 2011. PMID: 21542855
-
Targeting uracil-DNA glycosylases for therapeutic outcomes using insights from virus evolution.Future Med Chem. 2019 Jun;11(11):1323-1344. doi: 10.4155/fmc-2018-0319. Epub 2019 Jun 4. Future Med Chem. 2019. PMID: 31161802 Review.
-
Role of host factors in bacteriophage φ29 DNA replication.Adv Virus Res. 2012;82:351-83. doi: 10.1016/B978-0-12-394621-8.00020-0. Adv Virus Res. 2012. PMID: 22420858 Review.
Cited by
-
Crystal structure and functional insights into uracil-DNA glycosylase inhibition by phage Φ29 DNA mimic protein p56.Nucleic Acids Res. 2013 Jul;41(13):6761-73. doi: 10.1093/nar/gkt395. Epub 2013 May 13. Nucleic Acids Res. 2013. PMID: 23671337 Free PMC article.
-
DNA-Binding Proteins Essential for Protein-Primed Bacteriophage Φ29 DNA Replication.Front Mol Biosci. 2016 Aug 5;3:37. doi: 10.3389/fmolb.2016.00037. eCollection 2016. Front Mol Biosci. 2016. PMID: 27547754 Free PMC article. Review.
-
Architecturally diverse proteins converge on an analogous mechanism to inactivate Uracil-DNA glycosylase.Nucleic Acids Res. 2013 Oct;41(18):8760-75. doi: 10.1093/nar/gkt633. Epub 2013 Jul 26. Nucleic Acids Res. 2013. PMID: 23892286 Free PMC article.
-
Using structural-based protein engineering to modulate the differential inhibition effects of SAUGI on human and HSV uracil DNA glycosylase.Nucleic Acids Res. 2016 May 19;44(9):4440-9. doi: 10.1093/nar/gkw185. Epub 2016 Mar 14. Nucleic Acids Res. 2016. PMID: 26980279 Free PMC article.
-
Viruses with U-DNA: New Avenues for Biotechnology.Viruses. 2021 May 10;13(5):875. doi: 10.3390/v13050875. Viruses. 2021. PMID: 34068736 Free PMC article. Review.
References
-
- Lindahl T. Instability and decay of the primary structure of DNA. Nature. 1993;362:709–715. - PubMed
-
- Kavli B, Otterlei M, Slupphaug G, Krokan HE. Uracil in DNA-general mutagen, but normal intermediate in acquired immunity. DNA Repair. 2007;6:505–516. - PubMed
-
- Mosbaugh DW, Bennett SE. Uracil-excision DNA repair. Prog. Nucleic Acids Res. Mol. Biol. 1994;48:315–370. - PubMed
-
- Krokan HE, Drablos F, Slupphaug G. Uracil in DNA–occurrence, consequences and repair. Oncogene. 2002;21:8935–8948. - PubMed
-
- Pearl LH. Structure and function in the uracil-DNA glycosylase superfamily. Mutat. Res. 2000;460:165–181. - PubMed
Publication types
MeSH terms
Substances
Associated data
- Actions
