The critical role of the epidermal growth factor receptor in endochondral ossification
- PMID: 21887704
- PMCID: PMC3200483
- DOI: 10.1002/jbmr.502
The critical role of the epidermal growth factor receptor in endochondral ossification
Abstract
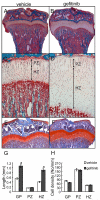
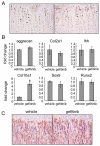
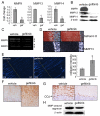
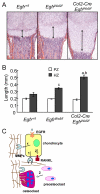
Loss of epidermal growth factor receptor (EGFR) activity in mice alters growth plate development, impairs endochondral ossification, and retards growth. However, the detailed mechanism by which EGFR regulates endochondral bone formation is unknown. Here, we show that administration of an EGFR-specific small-molecule inhibitor, gefitinib, into 1-month-old rats for 7 days produced profound defects in long bone growth plate cartilage characterized by epiphyseal growth plate thickening and massive accumulation of hypertrophic chondrocytes. Immunostaining demonstrated that growth plate chondrocytes express EGFR, but endothelial cells and osteoclasts show little to no expression. Gefitinib did not alter chondrocyte proliferation or differentiation and vascular invasion into the hypertrophic cartilage. However, osteoclast recruitment and differentiation at the chondro-osseous junction were attenuated owing to decreased RANKL expression in the growth plate. Moreover, gefitinib treatment inhibited the expression of matrix metalloproteinases (MMP-9, -13, and -14), increased the amount of collagen fibrils, and decreased degraded extracellular matrix products in the growth plate. In vitro, the EGFR ligand transforming growth factor α (TGF-α) strongly stimulated RANKL and MMPs expression and suppressed osteoprotegerin (OPG) expression in primary chondrocytes. In addition, a mouse model of cartilage-specific EGFR inactivation exhibited a similar phenotype of hypertrophic cartilage enlargement. Together our data demonstrate that EGFR signaling supports osteoclastogenesis at the chondro-osseous junction and promotes chondrogenic expression of MMPs in the growth plate. Therefore, we conclude that EGFR signaling plays an essential role in the remodeling of growth plate cartilage extracellular matrix into bone during endochondral ossification.
Copyright © 2011 American Society for Bone and Mineral Research.
Figures


Similar articles
-
Complementary interplay between matrix metalloproteinase-9, vascular endothelial growth factor and osteoclast function drives endochondral bone formation.Dis Model Mech. 2010 Mar-Apr;3(3-4):224-35. doi: 10.1242/dmm.004226. Epub 2010 Feb 8. Dis Model Mech. 2010. PMID: 20142327 Free PMC article.
-
ADAM17 controls endochondral ossification by regulating terminal differentiation of chondrocytes.Mol Cell Biol. 2013 Aug;33(16):3077-90. doi: 10.1128/MCB.00291-13. Epub 2013 Jun 3. Mol Cell Biol. 2013. PMID: 23732913 Free PMC article.
-
Epidermal growth factor receptor (EGFR) signaling regulates epiphyseal cartilage development through β-catenin-dependent and -independent pathways.J Biol Chem. 2013 Nov 8;288(45):32229-32240. doi: 10.1074/jbc.M113.463554. Epub 2013 Sep 18. J Biol Chem. 2013. PMID: 24047892 Free PMC article.
-
Matrix metalloproteinases: role in skeletal development and growth plate disorders.Front Biosci. 2006 May 1;11:1702-15. doi: 10.2741/1916. Front Biosci. 2006. PMID: 16368549 Review.
-
Matrix remodeling during endochondral ossification.Trends Cell Biol. 2004 Feb;14(2):86-93. doi: 10.1016/j.tcb.2003.12.003. Trends Cell Biol. 2004. PMID: 15102440 Free PMC article. Review.
Cited by
-
Macro, Micro, and Molecular. Changes of the Osteochondral Interface in Osteoarthritis Development.Front Cell Dev Biol. 2021 May 10;9:659654. doi: 10.3389/fcell.2021.659654. eCollection 2021. Front Cell Dev Biol. 2021. PMID: 34041240 Free PMC article. Review.
-
EGFR Signaling: Friend or Foe for Cartilage?JBMR Plus. 2019 Feb 13;3(2):e10177. doi: 10.1002/jbm4.10177. eCollection 2019 Feb. JBMR Plus. 2019. PMID: 30828691 Free PMC article. Review.
-
Conditional inactivation of TNFα-converting enzyme in chondrocytes results in an elongated growth plate and shorter long bones.PLoS One. 2013;8(1):e54853. doi: 10.1371/journal.pone.0054853. Epub 2013 Jan 18. PLoS One. 2013. PMID: 23349978 Free PMC article.
-
Overexpression of MIG-6 in the cartilage induces an osteoarthritis-like phenotype in mice.Arthritis Res Ther. 2020 May 19;22(1):119. doi: 10.1186/s13075-020-02213-z. Arthritis Res Ther. 2020. PMID: 32430054 Free PMC article.
-
Chondrocyte Hypertrophy in Osteoarthritis: Mechanistic Studies and Models for the Identification of New Therapeutic Strategies.Cells. 2022 Dec 13;11(24):4034. doi: 10.3390/cells11244034. Cells. 2022. PMID: 36552796 Free PMC article. Review.
References
-
- Karsenty G, Wagner EF. Reaching a genetic and molecular understanding of skeletal development. Dev Cell. 2002;2(4):389–406. - PubMed
-
- Kronenberg HM. Developmental regulation of the growth plate. Nature. 2003;423(6937):332–6. - PubMed
-
- Citri A, Yarden Y. EGF-ERBB signalling: towards the systems level. Nat Rev Mol Cell Biol. 2006;7(7):505–16. - PubMed
-
- Miettinen PJ, Berger JE, Meneses J, Phung Y, Pedersen RA, Werb Z, Derynck R. Epithelial immaturity and multiorgan failure in mice lacking epidermal growth factor receptor. Nature. 1995;376(6538):337–41. - PubMed
-
- Sibilia M, Wagner EF. Strain-dependent epithelial defects in mice lacking the EGF receptor. Science. 1995;269(5221):234–8. - PubMed
Publication types
MeSH terms
Substances
Grants and funding
LinkOut - more resources
Full Text Sources
Molecular Biology Databases
Research Materials
Miscellaneous

