. 2011 Sep 13;108(37):E689-98.
doi: 10.1073/pnas.1108866108. Epub 2011 Aug 22.

CD4+ T cells from elite suppressors are more susceptible to HIV-1 but produce fewer virions than cells from chronic progressors

Affiliations

CD4+ T cells from elite suppressors are more susceptible to HIV-1 but produce fewer virions than cells from chronic progressors

Karen A O'Connell et al. Proc Natl Acad Sci U S A. .

Abstract

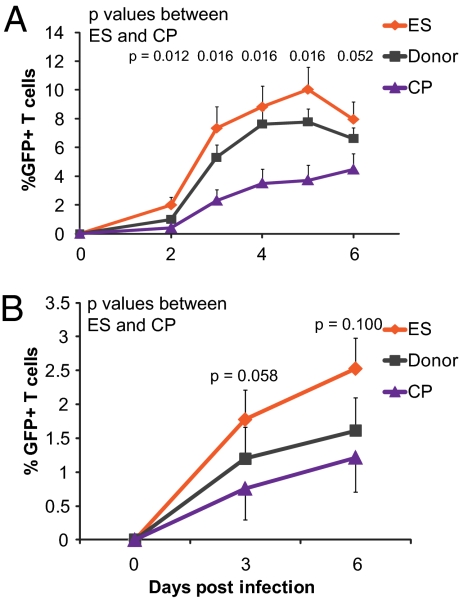
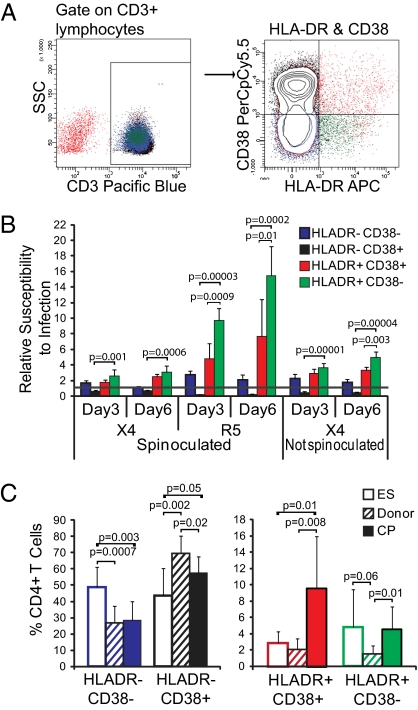
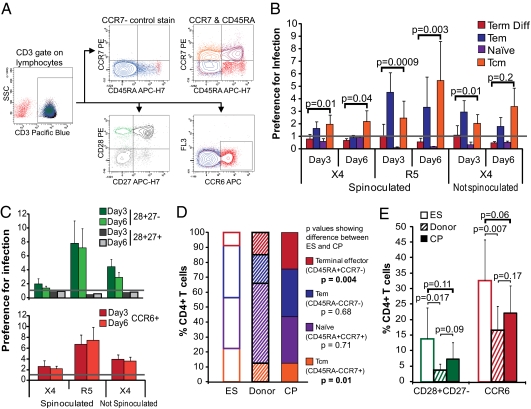
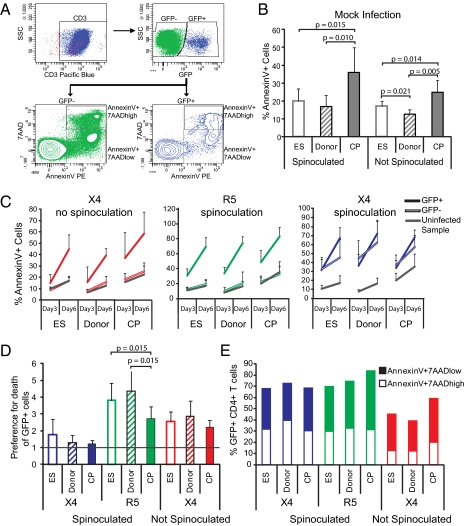
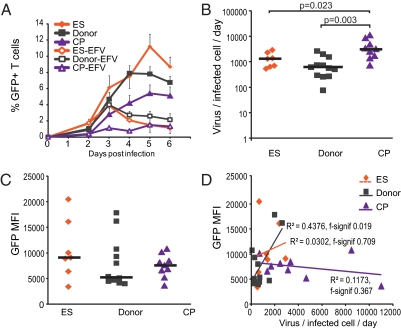
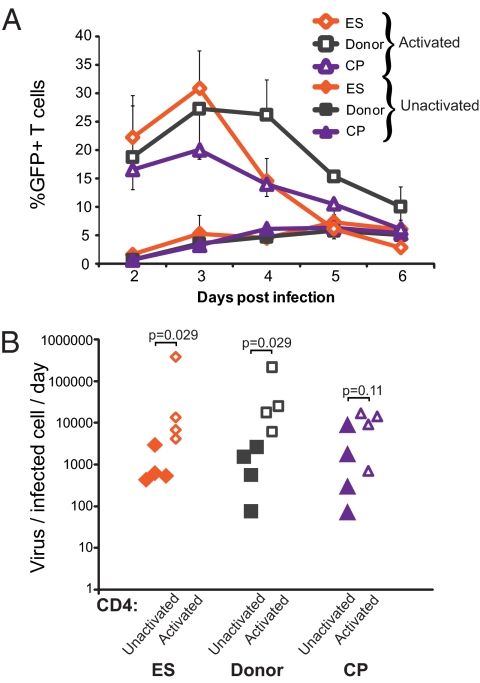
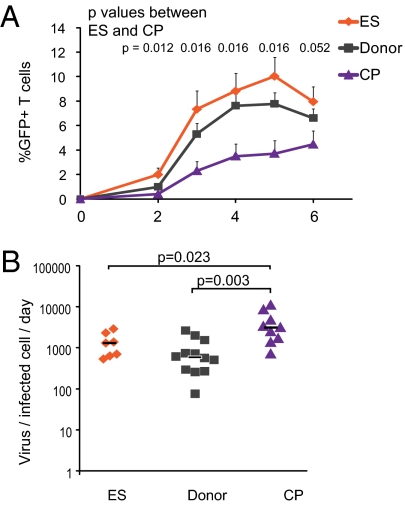
Elite suppressors/controllers (ES) are HIV-1-infected individuals who maintain stable CD4(+) T-cell counts and viral loads of <50 copies/mL without antiretroviral therapy. Research has predominantly focused on immune factors contributing to the control of viral replication in these patients. A more fundamental question, however, is whether there are differences in the nature of CD4(+) T-cell infection in ES compared with viremic patients. Here, we compare chronic progressor (CP), ES, and uninfected donors in terms of three aspects of CD4(+) T-cell infection: cellular susceptibility to infection, death of infected cells, and production of virus from infected cells. Using multiple methods of infection and both single-cycle and replication-competent virus, we show that unmanipulated CD4(+) T-cell populations from ES are actually more susceptible to HIV-1 infection than those populations from CP. Depletion of highly susceptible cells in CP may contribute to this difference. Using 7AAD and AnnexinV staining, we show that infected cells die more rapidly than uninfected cells, but the increased death of infected cells from CP and ES is proportional. Finally, using an assay for measuring virus production, we show that virus production by cells from CP is high compared with virus production by cells from ES or uninfected donors. This higher virus production is linked to cellular activation levels. These data identify fundamental differences in chronic infection of ES and CP that likely contribute to differential HIV-1 disease progression.


Conflict of interest statement

The authors declare no conflict of interest.

Figures

Fig. 1.
Fig. 1.
CD4+ T cells from ES are more susceptible to HIV-1 infection than cells from CP or donors. (A) Mean infection of unstimulated CD4+ T cells infected with replication-competent NL43 virus in which GFP was inserted into the nef gene. Infection was through spinoculation. n = 6, 9, and 6 for ES, donors, and CP, respectively. (B) Mean infection of unstimulated CD4+ T cells infected with single-cycle X4 virus without spinoculation. Virus was incubated with CD4+ T cells at 37 °C for 18 h. After 18 h, virus was removed, and the entry inhibitor T20 was added to prevent additional infection events. For ES, donors, and CP, n = 8, 9, and 8, respectively. Error bars depict SEM, and P values indicate differences between ES and CP at each time point; they are from the Wilcoxon signed rank test. Median was calculated in addition to the mean, and it was essentially equivalent.
Fig. 2.
Fig. 2.
Activated CD4+ T cells are preferentially infected. (A) Representative flow cytometric analysis of HLA-DR and CD38 expression on CD4+ T cells from study subjects. Gating was on lymphocyte population and then CD3+ T cells, because CD4 is down-regulated on infected cells. Cells were purified CD4+ T cells that had fewer than 1% contaminating CD8+ cells (Methods). (B) Unstimulated CD4+ T cells from four to six uninfected donors were infected with X4 or R5 virus with or without spinoculation as indicated, and cells were stained with CD3, HLA-DR, and CD38 on days 3 and 6 postinfection. The percentage of GFP+ cells expressing HLA-DR and CD38 in combination was divided by the percentage of overall T cells expressing that combination to define a preference for infection. Preference is indicated by y = 1.0 line. (C) Frequency of HLA-DR and CD38 cell populations in CD4+ T cells from ES, donors, and CP. Unstimulated cells from each patient group were analyzed by flow cytometry. P values for B and C are from two-tailed Student t tests. For ES, donors, and CP, n = 8, 10, and 7, respectively.
Fig. 3.
Fig. 3.
Memory T cells are preferentially infected. (A) Representative flow cytometric analysis of CD45RA, CCR7, CCR6, CD28, and CD27 expression on CD4+ T cells from study subjects. Gating was on the lymphocyte population and then CD3+ T cells, because CD4 is down-regulated on infected cells. Cells were purified CD4+ T cells that had fewer than 1% contaminating CD8+ cells (Methods). The CCR7 stain was used to set the CCR7 gate, because CCR7 staining had low MFI. (B) Unstimulated CD4+ T cells from four to six uninfected donors were infected with X4- or R5-tropic virus with or without spinoculation as indicated, and cells were stained with CD3, CD45RA, and CCR7 on days 3 and 6 postinfection. The percentage of GFP+ cells expressing the markers was divided by the percentage of overall T cells expressing that combination to define a preference for infection. Preference is indicated by y = 1.0 line, and P values comparing terminally differentiated effector and Tcm cells frequencies are shown. (C) Same as B but for CD28 and CD27 expression and CCR6 expression. (D) Frequency of CCR7 and CD45RA expressing subsets in ES, donors, and CP. Unstimulated cells from each patient group were analyzed by flow cytometry. (E) Same as D but for CD28, CD27, and CCR6 expression. For ES, donors, and CP, n = 8, 10, and 7, respectively. P values for B–E are from two-tailed Student t tests.
Fig. 4.
Fig. 4.
Death rate of infected and uninfected cells. (A) Representative flow cytometry data depicting gating on lymphocyte population followed by CD3+ cells and then considering GFP+ and GFP cells for the AnnexinV analysis. For all data shown (with the exception of E), the total AnnexinV+ population was considered. (B) Average of AnnexinV+ CD4+ T cells from ES, donors, and CP on day 6 of culture without infection. Error bars are SD. (C) GFP+ (infected) cells are dying more than GFP (uninfected) cells. Percentage of CD4+ T cells that are GFP+ (solid lines) cells, GFP (hollow lines) cells, and cells from an uninfected control sample (gray) dying on days 3 and 6 after infection with X4 virus without spinoculation, R5 virus with spinoculation, and X4 virus with spinoculation. Averages and SDs are shown. (D) The percentage of GFP+AnnexinV+ cells was divided by the percentage of GFPAnnexinV+ cells in each sample of cells from ES, donors, and CP infected with X4 virus through spinoculation, R5 virus through spinoculation, and X4 virus without spinoculation on day 6 postinfection. Averages and SDs are shown. The line at y = 1 indicates preference for death of GFP+ cells. (E) Average of AnnexinV+7AADhigh and 7AADlow cell populations in ES, donors, and CP for GFP+ CD4+ T cells. P values are from Wilcoxon signed rank test. For ES, donors, and CP, n = 8, 9, and 8, respectively.
Fig. 5.
Fig. 5.
Infected cells from CP produce more virus than cells from ES or donors. (A) Infection data are the same as those data shown in Fig. 1A, with the addition of data for the percent GFP after the addition of Efavirenz, which is indicated by EFV. Efavirenz was added at day 2 postinfection to block new infection events so that viral budding could be quantified. Mean is shown, and error bars are SEM. (B) Virus production was measured by quantifying viral mRNA released from infected cells. Viral mRNA per infected cells was then calculated using the GFP percent shown in A. P values are derived from the Wilcoxon signed rank test, and black bars indicate median. (C) MFI of GFP for infected cells; black bars indicate median. Differences were insignificant by the Wilcoxon signed ranked test (P > 0.3 for all). (D) MFI of GFP for infected cells was measured and correlated to viral production per infected cell for all three patient groups. For ES, donors, and CP, n = 7, 12, and 9, respectively.
Fig. 6.
Fig. 6.
Activation of T cells increases virus production per infected cell. (A) GFP expression of cells that were activated with PHA (open symbols) or not activated (solid symbols) for ES, donors, and CP are shown. Averages are shown, and error bars are SEM. (B) Virus produced per infected cell per day for both activated (open symbols) and unactivated (solid symbols) CD4+ T cells from the patient groups. P values are from Wilcoxon signed rank tests. For ES, donors, and CP, n = 4 for all groups.
Fig. P1.
Fig. P1.
(A) Mean infection of unstimulated CD4+ T cells infected with replication-competent NL43 virus in which GFP was inserted into the nef gene. Infection was through spinoculation; n = 6, 9, and 6 for ES, donors, and CP, respectively. Error bars depict SEM, and P values indicate differences between ES and CP at each time point and are from the Wilcoxon signed rank test. Median was calculated in addition to mean and was essentially equivalent. (B) Virus production was measured by quantifying viral mRNA released from infected cells. Viral mRNA per infected cells was then calculated using the GFP percent. P values are derived from the Wilcoxon signed rank test, and black bars indicate median.

Similar articles

Cited by

References

    1. O'Connell KA, Bailey JR, Blankson JN. Elucidating the elite: Mechanisms of control in HIV-1 infection. Trends Pharmacol Sci. 2009;30:631–637. - PubMed
    1. Migueles SA, Connors M. Long-term nonprogressive disease among untreated HIV-infected individuals: Clinical implications of understanding immune control of HIV. JAMA. 2010;304:194–201. - PubMed
    1. Mens H, et al. HIV-1 continues to replicate and evolve in patients with natural control of HIV infection. J Virol. 2010;84:12971–12981. - PMC - PubMed
    1. O'Connell KA, et al. Control of HIV-1 in elite suppressors despite ongoing replication and evolution in plasma virus. J Virol. 2010;84:7018–7028. - PMC - PubMed
    1. Salgado M, et al. Evolution of the HIV-1 nef gene in HLA-B*57 positive elite suppressors. Retrovirology. 2010;7:94. - PMC - PubMed

Publication types