. 2011 Oct 7;286(40):34903-13.
doi: 10.1074/jbc.M111.279190. Epub 2011 Aug 23.

Advanced glycation end products (AGEs) induce apoptosis via a novel pathway: involvement of Ca2+ mediated by interleukin-8 protein

Affiliations

Advanced glycation end products (AGEs) induce apoptosis via a novel pathway: involvement of Ca2+ mediated by interleukin-8 protein

Sidharth Mahali et al. J Biol Chem. .

Abstract

Advanced glycation end products (AGEs) accumulate in diabetic patients due to high blood glucose levels and cause multiple deleterious effects. In this study, we provide evidence that the AGE increased cell death, one such deleterious effect. Methyl glyoxal-coupled human serum albumin (AGE-HSA) induced transcription factors such as NF-κB, NF-AT, and AP-1. AGE acts through its cell surface receptor, RAGE, and degranulates vesicular contents including interleukin-8 (IL-8). The number of RAGEs, as well as the amount of NF-κB activation, is low, but the cell death is higher in neuronal cells upon AGE treatment. Degranulated IL-8 acts through its receptors, IL-8Rs, and induces sequential events in cells: increase in intracellular Ca(2+), activation of calcineurin, dephosphorylation of cytoplasmic NF-AT, nuclear translocation of NF-AT, and expression of FasL. Expressed FasL increases activity of caspases and induces cell death. Although AGE increases the amount of reactive oxygen intermediate, accompanying cell death is not dependent upon reactive oxygen intermediate. AGE induces autophagy, which partially protects cells from cell death. A novel mechanism of AGE-mediated cell death in different cell types, especially in neuronal cells where it is an early event, is provided here. Thus, this study may be important in several age-related neuronal diseases where AGE-induced apoptosis is observed because of high amounts of AGE.


Figures

FIGURE 1.
FIGURE 1.
Effect of AGE-HSA on cell death. A, U-937 cells were treated with AGE-HSA (100 μg/ml) for different times. After these treatments, cell death was detected by annexin V-phycoerythrin and analyzed in FACS. U-937 cells were treated with AGE-HSA (100 μg/ml) for different times. Then cells were washed, fixed with methanol, and stained with propidium iodide. B, cells were then taken in slides and visualized in fluorescence microscopes. U-937 cells were treated with different concentrations of AGE-HSA in triplicate for 48 h. Cell viability was assayed using MTT dye. C, results are represented as inhibition of cell viability in percentage, which is calculated from mean absorbance ± S.D. of triplicate samples. D, U-937 cells were treated with AGE-HSA (100 μg/ml) for different times, and caspase 3, 8, and 9 activities were measured and indicated as -fold of activation considering untreated value as 1-fold.
FIGURE 2.
FIGURE 2.
Effect of AGE-HSA on cell death in different cell types. A, U373, MCF-7, and U-937 cells were treated with different concentrations of AGE-HSA or 100 nm TNF for 24 h. Nuclear extracts were prepared and assayed for the NF-κB gel shift assay. These cells were treated with different concentrations of AGE-HSA for 72 h, and cell viability was assayed by MTT dye. B, results are represented as inhibition of cell viability in percentage, which is calculated from mean absorbance ± S.D. of triplicate samples. C, the amount of RAGE was measured from whole cell extracts (100 μg of proteins) by Western blot.
FIGURE 3.
FIGURE 3.
Effect of AGE-HSA on activation of transcription factors, NF-κB-dependent gene activation, and degranulation. A, U-937 cells were incubated with 100 μg/ml AGE-HSA for different times. Nuclear extracts were assayed for NF-κB, AP-1, and NF-AT DNA binding by gel shift assay. B, amounts of IκBα and p65 were measured from cytoplasmic extracts and p65 was measured from nuclear extracts by Western blot. C, the amounts of IL-8, ICAM1, and TNF were measured by RT-PCR from total RNA isolated from AGE-HSA-stimulated cells for different times. D, the cell culture supernatant was taken from AGE-HSA-stimulated cells for different times, and the amount of myeloperoxidase, alkaline phosphatase (Alk Phosphatase), and elastase was measured by measuring the activities of these enzymes as detected by specific chromogenic substrate. Error bars indicate ± S.D. of triplicate samples. E, upper panel, the culture supernatants were concentrated 10 times with a 3-kDa cut filter, and the amounts of IL-8 and proteinase 3 were measured by Western blot. E, lower panel, the amount of IL-8 was measured from whole cell extracts (200 μg of proteins) of the cell pellet upon similar treatment by Western blot.
FIGURE 4.
FIGURE 4.
Effect of antioxidants on AGE-HSA-induced ROI generation and cell death. A, U-937 cells were treated with 100 μg/ml AGE-HSA for different times or 100 pm TNF for 2 h. ROI generation was measured using dihydrorhodamine by FACS and indicated as the percentage detected from mean channel number. U-937 cells were pretreated with N-acetylcysteine (NAC, 10 mm), vitamin C (2 mm), or pyrrolidine dithiocarbamate (PDTC, 100 μm) for 2 h and then stimulated with 100 μg/ml AGE-HSA for 4 h. B, ROI generation was measured using dihydrorhodamine by FACS. Cells were pretreated with N-acetylcysteine (10 mm), vitamin C (2 mm), or pyrrolidine dithiocarbamate (100 μm) for 2 h and then stimulated with 100 μg/ml AGE-HSA for 48 h. C, cell death was determined by MTT assay and indicated in percentage. Error bars in A–C indicate ± S.D. of triplicate samples. D, the amount of cytochrome c was measured from cytoplasmic fraction of AGE-HSA (100 μg/ml)-treated cells for different times, keeping doxorubicin (Dox) (1 μm for 24 h) as positive control for different times by Western blot. E, the amounts of Bad and Bax were determined in the whole cell extracts obtained from AGE-HSA-treated cells for different times by Western blot.
FIGURE 5.
FIGURE 5.
Effect of AGE-HSA on intracellular Ca2+ release, calcineurin activation, NF-AT-dependent luciferase activity, and FasL expression. A, U-937 cells were treated with AGE-HSA (100 μg/ml) for different times. Intracellular free Ca2+ was measured using Fura-2AM as fluorescent probe in a fluorometer. Cells were treated with 100 μg/ml AGE-HSA for different times or CsA (2.5 μm) for 2 h and then treated with AGE-HSA for 48 h. B, calcineurin activity was assayed from whole cell extracts. U-937 cells were transfected with Qiagen SuperFect reagent for 3 h with plasmids for NF-AT or FasL promoter DNA that had been linked to luciferase (NF-AT-luciferase or FasL-luciferase) and GFP. After washing, cells were cultured for 12 h. The GFP-positive cells were, counted and transfection efficiency was calculated. C and D2, cells, treated with AGE-HSA (100 μg/ml) for different times, were extracted, and the luciferase activity was measured as per Promega protocol and indicated as -fold of activation. D1, the amount of FasL was measured from whole cell extracts upon similar treatment by Western blot. Error bars in B, C, and D2 indicate ± S.D. of triplicate samples.
FIGURE 6.
FIGURE 6.
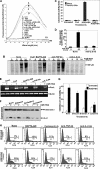
Effect of Ca2+ chelator and anti-IL-8, -TNF, or -FasL Ab on AGE-mediated cell death. A, U-937 cells were preincubated with 1 μg/ml anti-IL-8 or -TNF Ab for 2 h and then stimulated with AGE-HSA (100 μg/ml) for 24 h or with IL-8 (100 ng/ml) or TNF (100 pm) for 2 h. Cells were washed, and intracellular Ca2+ was measured using Fura-2AM as fluorescence probe in a fluorometer fixing emission at 510 nm and excitation from 300 to 400 nm. B, U-937 cells were preincubated with CsA (2.5 μm) and BAPTA-AM (5 μm) or with anti-TNF or -IL-8 Ab for 2 h and then stimulated with AGE-HSA for different times. Nuclear extracts were used to assay NF-κB DNA binding by gel shift assay. Cells were preincubated with CsA and anti-IL-8 Ab for 2 h and then stimulated with AGE-HSA for 24 h. C, calcineurin activity was measured from whole cell extracts and indicated as -fold of activation considering value of unstimulated cells as 1-fold. U-937 cells were transfected with Qiagen SuperFect reagent for 3 h with plasmids for FasL promoter DNA that had been linked to luciferase (FasL-luciferase) and GFP. After washing, cells were cultured for 12 h. Cells, incubated with anti-IL-8 Ab for 2 h, were stimulated with AGE-HSA (100 μg/ml) for 48 h. D, the luciferase activity was measured from whole cell extracts and indicated as -fold of activation. E, cells were preincubated with CsA, BAPTA-AM, anti-TNF Ab, or anti-IL-8 Ab for 2 h and then stimulated with AGE-HSA for 48 h. FasL was detected by RT-PCR from total RNA isolated from cells. F, U-937 cells, treated with cystamine (500 μm), brefeldin A (5 μg/ml), or diltiazem (100 μm) for 2 h, were stimulated with AGE-HSA for 24 h. Culture supernatant was concentrated 10 times and used to detect IL-8 and proteinase 3 by Western blot. Cells, treated with diltiazem, brefeldin A, or cystamine for 2 h in triplicate, were stimulated with AGE-HSA for 48 h. G, the MTT assay was done and indicated as inhibition of cell death in percentage. U-937 cells, incubated with anti-IL-8 Ab, anti-TNF Ab, CsA, or BAPTA-AM for 2 h, were stimulated with AGE-HSA for 48 h. Error bars in C, D, and G indicate ± S.D. of triplicate samples. H, after these treatments, cell death was detected by annexin V-phycoerythrin and analyzed in FACS.
FIGURE 7.
FIGURE 7.
Effect of AGE in inducing autophagy. A, U-937 cells were incubated with 100 μg/ml AGE-HSA for 48 h. Cells were washed and incubated with MDC (0.05 mm) for 10 min. The fluorescent cells were visualized under a fluorescence microscope. U-937 cells were pretreated with 3-methyl adenine (3MA, 5 mm) and then incubated with AGE-HSA (100 μg/ml) for 48 h. After incubation, cells were washed and incubated with MDC. B, intracellular MDC was measured by fluorescence photometry (excitation 380 nm and emission 525 nm). RFU, relative fluorescence units. C, the MDC incorporated was expressed as specific activity (arbitrary units). U-937 cells were pretreated with 3-methyl adenine (5 mm) and then incubated with AGE-HSA for 48 h. D, the cells were observed under bright field microscopy. U-937 cells, incubated with AGE-HSA (100 μg/ml) for 45 h, were co-incubated with bafilomycin (100 nm) for 3 h. E, cell viability was measured by MTT assay and indicated as inhibition of cell viability in percentage. Error bars in B and E indicate ± S.D. of triplicate samples.

Similar articles

Cited by

References

    1. Franceschi C., Bonafè M., Valensin S., Olivieri F., De Luca M., Ottaviani E., De Benedictis G. (2000) Ann. N.Y. Acad. Sci. 908, 244–254 - PubMed
    1. Khuhawar M. Y., Kandhro A. J., Khand F. D. (2006) Anal. Lett. 39, 2205–2215
    1. Lapolla A., Flamini R., Dalla Vedova A., Senesi A., Reitano R., Fedele D., Basso E., Seraglia R., Traldi P. (2003) Clin. Chem. Lab. Med. 41, 1166–1173 - PubMed
    1. Odani H., Shinzato T., Matsumoto Y., Usami J., Maeda K. (1999) Biochem. Biophys. Res. Commun. 256, 89–93 - PubMed
    1. Singh R., Barden A., Mori T., Beilin L. (2001) Diabetologia 44, 129–146 - PubMed

Publication types

LinkOut - more resources