

Ethnic and mouse strain differences in central corneal thickness and association with pigmentation phenotype
- PMID: 21853026
- PMCID: PMC3154201
- DOI: 10.1371/journal.pone.0022103
Ethnic and mouse strain differences in central corneal thickness and association with pigmentation phenotype
Abstract
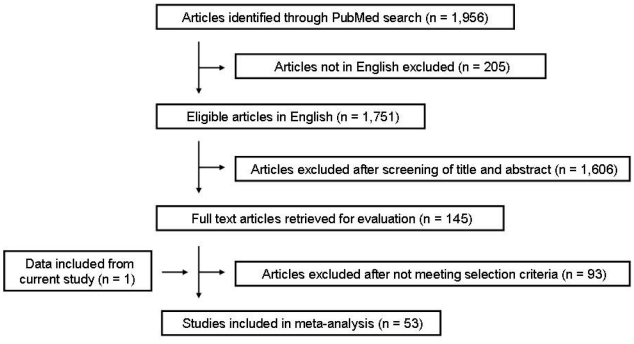
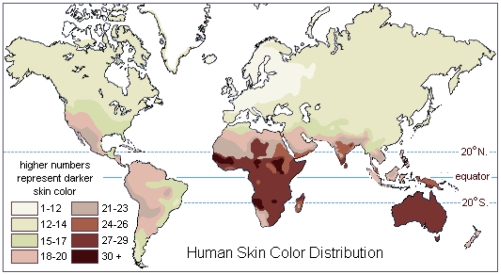
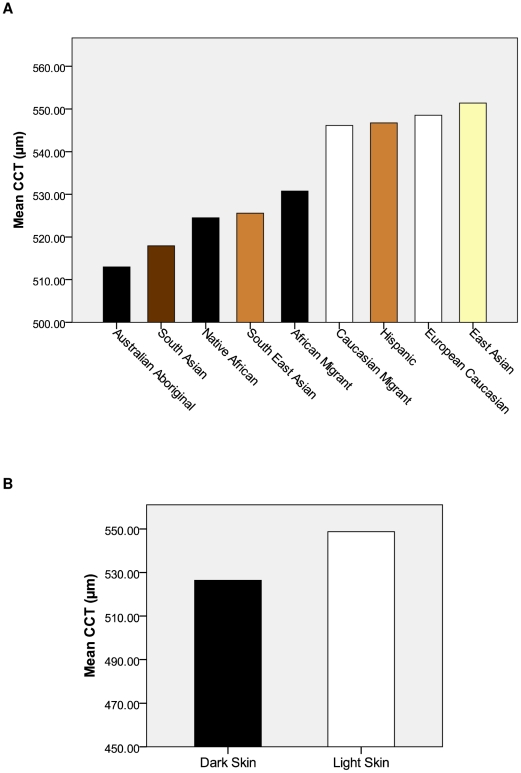
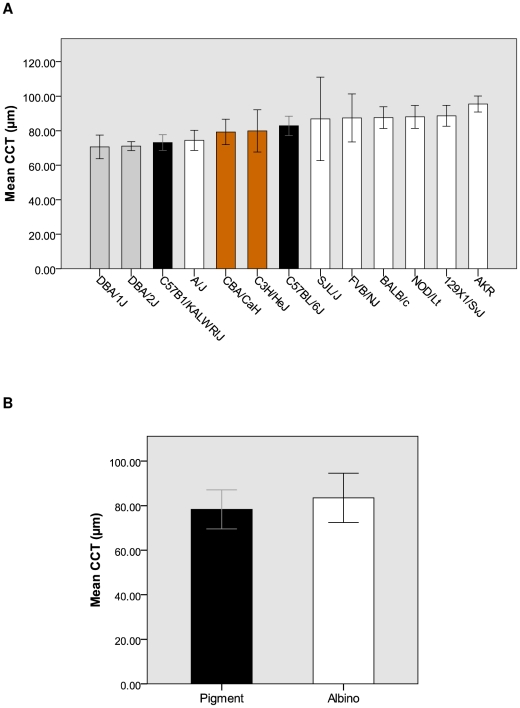
The cornea is a transparent structure that permits the refraction of light into the eye. Evidence from a range of studies indicates that central corneal thickness (CCT) is strongly genetically determined. Support for a genetic component comes from data showing significant variation in CCT between different human ethnic groups. Interestingly, these studies also appear to show that skin pigmentation may influence CCT. To validate these observations, we undertook the first analysis of CCT in an oculocutaneous albinism (OCA) and Ugandan cohort, populations with distinct skin pigmentation phenotypes. There was a significant difference in the mean CCT of the OCA, Ugandan and Australian-Caucasian cohorts (Ugandan: 517.3±37 µm; Caucasian: 539.7±32.8 µm, OCA: 563.3±37.2 µm; p<0.001). A meta-analysis of 53 studies investigating the CCT of different ethnic groups was then performed and demonstrated that darker skin pigmentation is associated with a thinner CCT (p<0.001). To further verify these observations, we measured CCT in 13 different inbred mouse strains and found a significant difference between the albino and pigmented strains (p = 0.008). Specific mutations within the melanin synthesis pathway were then investigated in mice for an association with CCT. Significant differences between mutant and wild type strains were seen with the nonagouti (p<0.001), myosin VA (p<0.001), tyrosinase (p = 0.025) and tyrosinase related protein (p = 0.001) genes. These findings provide support for our hypothesis that pigmentation is associated with CCT and identifies pigment-related genes as candidates for developmental determination of a non-pigmented structure.
Conflict of interest statement
Figures
Similar articles
-
Nitisinone improves eye and skin pigmentation defects in a mouse model of oculocutaneous albinism.J Clin Invest. 2011 Oct;121(10):3914-23. doi: 10.1172/JCI59372. J Clin Invest. 2011. PMID: 21968110 Free PMC article.
-
The genetics of central corneal thickness.Br J Ophthalmol. 2010 Aug;94(8):971-6. doi: 10.1136/bjo.2009.162735. Epub 2009 Jun 24. Br J Ophthalmol. 2010. PMID: 19556215 Review.
-
Identification of four novel variants that influence central corneal thickness in multi-ethnic Asian populations.Hum Mol Genet. 2012 Jan 15;21(2):437-45. doi: 10.1093/hmg/ddr463. Epub 2011 Oct 7. Hum Mol Genet. 2012. PMID: 21984434
-
Genomic locus modulating corneal thickness in the mouse identifies POU6F2 as a potential risk of developing glaucoma.PLoS Genet. 2018 Jan 25;14(1):e1007145. doi: 10.1371/journal.pgen.1007145. eCollection 2018 Jan. PLoS Genet. 2018. PMID: 29370175 Free PMC article.
-
Genetics of pigmentation in skin cancer--a review.Mutat Res. 2010 Oct;705(2):141-153. doi: 10.1016/j.mrrev.2010.06.002. Epub 2010 Jun 30. Mutat Res. 2010. PMID: 20601102 Review.
Cited by
-
Development of eye phantom for mimicking the deformation of the human cornea accompanied by intraocular pressure alterations.Sci Rep. 2022 Nov 30;12(1):20670. doi: 10.1038/s41598-022-24948-2. Sci Rep. 2022. PMID: 36450788 Free PMC article.
-
SNP in human ARHGEF3 promoter is associated with DNase hypersensitivity, transcript level and platelet function, and Arhgef3 KO mice have increased mean platelet volume.PLoS One. 2017 May 23;12(5):e0178095. doi: 10.1371/journal.pone.0178095. eCollection 2017. PLoS One. 2017. PMID: 28542600 Free PMC article.
-
Theranostic Approach for Metastatic Pigmented Melanoma Using ICF15002, a Multimodal Radiotracer for Both PET Imaging and Targeted Radionuclide Therapy.Neoplasia. 2017 Jan;19(1):17-27. doi: 10.1016/j.neo.2016.11.001. Epub 2016 Dec 14. Neoplasia. 2017. PMID: 27987437 Free PMC article.
-
Cutaneous pigmentation modulates skin sensitivity via tyrosinase-dependent dopaminergic signalling.Sci Rep. 2017 Aug 23;7(1):9181. doi: 10.1038/s41598-017-09682-4. Sci Rep. 2017. PMID: 28835637 Free PMC article.
-
Impact of repeated topical-loaded manganese-enhanced MRI on the mouse visual system.Invest Ophthalmol Vis Sci. 2012 Jul 12;53(8):4699-709. doi: 10.1167/iovs.12-9715. Invest Ophthalmol Vis Sci. 2012. PMID: 22700708 Free PMC article.
References
-
- Gordon MO, Beiser JA, Brandt JD, Heuer DK, Higginbotham EJ, et al. The Ocular Hypertension Treatment Study: baseline factors that predict the onset of primary open-angle glaucoma. Arch Ophthalmol. 2002;120:714–720; discussion 829–730. - PubMed
-
- Miglior S, Pfeiffer N, Torri V, Zeyen T, Cunha-Vaz J, et al. Predictive factors for open-angle glaucoma among patients with ocular hypertension in the European Glaucoma Prevention Study. Ophthalmology. 2007;114:3–9. - PubMed
-
- Brandt JD, Casuso LA, Budenz DL. Markedly increased central corneal thickness: an unrecognized finding in congenital aniridia. Am J Ophthalmol. 2004;137:348–350. - PubMed
-
- Whitson JT, Liang C, Godfrey DG, Petroll WM, Cavanagh HD, et al. Central corneal thickness in patients with congenital aniridia. Eye Contact Lens. 2005;31:221–224. - PubMed
Publication types
MeSH terms
LinkOut - more resources
Full Text Sources
Molecular Biology Databases
