. 2011;6(7):e21667.
doi: 10.1371/journal.pone.0021667. Epub 2011 Jul 28.

A high resolution genome-wide scan of HNF4α recognition sites infers a regulatory gene network in colon cancer

Affiliations

A high resolution genome-wide scan of HNF4α recognition sites infers a regulatory gene network in colon cancer

Fridtjof Weltmeier et al. PLoS One. 2011.

Abstract

The hepatic nuclear factor HNF4α is a versatile transcription factor and controls expression of many genes in development, metabolism and disease. To delineate its regulatory gene network in colon cancer and to define novel gene targets a comprehensive genome-wide scan was carried out at a resolution of 35 bp with chromatin IP DNA obtained from the human colon carcinoma cell line Caco-2 that is a particularly rich source of HNF4α. More than 90% of HNF4α binding sites were mapped as promoter distal sequences while enhancer elements could be defined to foster chromatin loops for interaction with other promoter-bound transcription factors. Sequence motif analysis by various genetic algorithms evidenced a unique enhanceosome that consisted of the nuclear proteins ERα, AP1, GATA and HNF1α as cooperating transcription factors. Overall >17,500 DNA binding sites were identified with a gene/binding site ratio that differed >6-fold between chromosomes and clustered in distinct chromosomal regions amongst >6600 genes targeted by HNF4α. Evidence is presented for nuclear receptor cross-talk of HNF4α and estrogen receptor α that is recapitulated at the sequence level. Remarkably, the Y-chromosome is devoid of HNF4α binding sites. The functional importance of enrichment sites was confirmed in genome-wide gene expression studies at varying HNF4α protein levels. Taken collectively, a genome-wide scan of HNF4α binding sites is reported to better understand basic mechanisms of transcriptional control of HNF4α targeted genes. Novel promoter distal binding sites are identified which form an enhanceosome thereby facilitating RNA processing events.


Conflict of interest statement

Competing Interests: The authors have declared that no competing interests exist.

Figures

Figure 1
Figure 1. Venn diagram of overlap between HNF 4α binding sites identified by different algorithms.
Raw data was analyzed with three different programs (Tilemap, MAT and TAS) to identify HNF4α binding sites. Although different parameter settings (e.g. band width of 200, 300 and 400 nucleotides) and different algorithms were used, the overlap was surprisingly high. The Venn diagram was calculated using the intersect function of Galaxy .
Figure 2
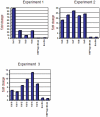
Figure 2. Validation of HNF4α binding sites.
Enrichment of novel HNF4α binding sites detected by ChIP-chip was confirmed by real time PCR. ChIP-DNA from three independent experiments was used. Normalization was performed using a β-actin negative control, and the values are shown as fold enrichment versus total input. HNF1α upstream is a second negative control, located upstream of the known HNF4α binding site in the HNF1α promoter and is used to confirm the ß-actin negative control.
Figure 3
Figure 3. Enriched regions contain HNF4α binding motifs that are highly conserved.
a) HNF4α motifs in the area of 1,000 bp surrounding enrichment site (ES) peak or center positions as detected with MATCH, using cutoffs to minimize false positives. The distance of the center of detected motifs to the peak or center position of the ES was calculated. A histogram was created using bins of 50 nucleotides around the center or peak positions. The blue line shows the deviation of HNF4α motifs relative to the ES center, the red line shows the deviation relative to the peak position. b) HNF4α ChIP-chip ES to allow easy de novo prediction of the HNF4α binding motif. After analysis of the sequence of regions enriched by HNF4α ChIP-chip with Gibbs motif sampler, the HNF4α-motif was actually detected two times, with the second motif presenting only half a site. c) Conservation of all HNF4α binding sites (blue line). ES centers (blue) or Peak positions (red) were extended to 1,000 bp in both directions, and for each nucleotide the average conservation score, based on the high-quality phast-Cons information from the UCSC GoldenPath Genome Resource, was calculated. The average conservation scores were plotted against the nucleotides position. Analyses were performed with CEAS .
Figure 4
Figure 4. Distribution of ES relative to RefSeq loci.
a) Location of HNF4α binding sites relative to the closest TSS of RefSeq genes as compared to random distribution. The regions of 100,000 nucleotides surrounding each TSS were divided into bins of 5,000 nucleotides, and the number of binding sites in each bin was counted. b) Genomic distribution of HNF4α binding sites. The number of binding sites located in the specified regions of RefSeq annotated genes was calculated by the software tool CisGenome. TSSup1k: 1,000 bp upstream of a transcription start site (TSS); TESdown1k: 1,000 bp downstream of a transcription end site. c) Distribution of HNF4α binding sites located proximal to TSS of RefSeq genes, compared to random distribution. The regions of 5,000 nucleotides surrounding each TSS were divided into bins of 200 nucleotides, and the number of binding sites in each bin was counted. d) Overrepresentation of HNF4α binding sites in upstream and downstream TSS proximal regions and in first, second an third introns of RefSeq annotated genes, relative to a random control regions. The positions of TSS, first, second and third introns of RefSeq annotated genes were retrieved from UCSC, and the number of HNF4α binding sites located in the specified regions was calculated. TSSup600: 600 bp upstream of a transcription start site; TSSdown600: 600 bp downstream of a transcription start site; TSSup10k: 10,000 bp upstream of a TSS; TSSdown10k: 10,000 bp downstream of a TSS.
Figure 5
Figure 5. Promoter-proximal ES of HNF4α.
a) Bootstrapping analysis of HNF4α binding motif (matrix M01031) in promoter-proximal and promoter distal regions. 100 promoter-proximal ES (−138 to −2 relative to the TSS) were compared to 100 promoter-distal ES (−24972 to −23489 relative to the TSS) by the bootstrapping analysis tool POBO . Promoter-proximal ES show a significantly lower number of HNF4α motifs. b) ES (300 bp surround the peak position) were sorted by their P-value (as calculated by the MAT algorithm) and divided into bins of 1,000 ES. For each bin the number of HNF4α motif occurrences and the percentage of promoter-proximal ES were calculated. As can be seen, ES with a high P-value (weak ES) are more likely to be located promoter-proximal but to contain no HNF4α binding motif.
Figure 6
Figure 6. Cluster of HNF4α binding sites.
a) The distribution of HNF4α binding sites (purple line chart, upper half) is compared to the distribution of known genes on chromosome 10. Green arrows mark two gene-sparse regions in which ES are found. The red arrows mark two regions with a high number of HNF4α binding sites and a low number of genes. Analyses were performed using the Ensembl tool Karyoview (http://www.ensembl.org/Homo_sapiens/karyoview). b) Clusters of HNF4α binding sites in a genomic region on chromosome 10 with high content of binding sites (the region marked by the second red arrow in a)). The binding sites identified in this study, displayed as blue peaks in the upper half, are presented using the IGB genome browser. The binding sites are distributed in two clusters around the transcription start site of the ACSL5 locus and in the 3′-region of the VTI1A locus.
Figure 7
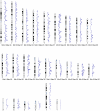
Figure 7. Chromosomal distribution of HNF4α ChIP enrichment sites.
Each chromosome was divided into 150 ‘bins’, and within each bin the number of ES was counted. In the blue line chart, the number of HNF4α binding sites within each bin is represented as a single data point. Below each chromosome the minimum and maximum number of binding sites located in a single bin is given. Analyses were performed using the Ensembl tool Karyoview (http://www.ensembl.org/Homo_sapiens/karyoview).
Figure 8
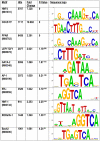
Figure 8. Motifs overrepresented within the ChIP-enriched regions.
The 10,000 most significant ChIP-enriched regions were analyzed for overrepresented motifs by use of the CEAS tool . Shown are the 10 motifs with the most significant enrichment, while redundant motifs (i.e. multiple motifs for the same transcription factor) were removed. The similarity or dissimilarity of the motifs is visualized by using Weblogo depiction (http://weblogo.berkeley.edu/). Motif enrichment analysis with Genomatix RegionMiner and MATCH are found in Tables S3, S4, S5.
Figure 9
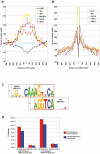
Figure 9. Distribution of AP1, CART, ERα, GATA2, HNF1α and SREBP motifs within regions enriched by HNF4α-ChIP.
a) Peak positions (represented as 0) were extended to 500 bp in both directions, and Motifs were detected by use of the MATCH algorithm using cutoff criteria to minimize the sum of false positives and false negatives. Regions were segmented into bins of 25 bp, and the number of occurrences of the different motifs within each bin was counted. b) Plot of the relative distance of HNF4α motifs to other motifs enriched in the ChIP region. Within ChIP regions the most conserved HNF4α motifs where identified. The sequences of the 500 nucleotides surrounding these most conserved HNF4α motifs where retrieved and analyzed for those motifs of other TF that were also enriched in the ChIP regions. Then, the distance between these motifs and the HNF4α motif was calculated using CisGenome for motif detection and plotted as histogram using bins of 20 bp. The HNF4α motif is found at the center, reaching from bp −6 to bp +6. HNF4α and ERα share common and overlapping binding sites. c) Display of the overlap between the binding motifs of HNF4α and the estrogen receptor (ERα) by use of Weblogo illustrations. Both motifs show a partial overlap. d) Overlap between ERα binding sites and HNF4α binding sites. The high stringency set of ERα binding sites identified by ChIP-chip was obtained. The percentage of ERα binding sites identified in this study and also bound by HNF4α is displayed in a bar chart. The overlap of ERα binding sites with random control regions was determined.
Figure 10
Figure 10. Comparison of HNF4α binding sites amongst different published studies.
Percentage of HNF4α binding sites identified by Rada-Iglesias et al. or Odom et al. which could be confirmed in this study. For Rada-Iglesias et al. a control group of random genomic sequences was used to calculate the random overlap. For Odom et al., a control group was created by selecting randomly a number of promoter regions from the Huk13 array used in their study, equal to the number of promoters they detected as being bound by HNF4α.
Figure 11
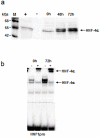
Figure 11. HNF4α protein expression and DNA binding activity with nuclear extracts isolated from Aroclor 1254 treated Caco-2 cells.
a) HNF4α Western blotting of 20 µg Caco-2 cell extract. A clear induction of HNF4α protein expression was seen after 48 h and 72 h of Aroclor1254 treatment. b) Electrophoretic mobility shift assays with 2.5 µg Caco-2 cell nuclear extract and oligonucleotides corresponding to the A-site of the HNF1α promoter (HNF1pro) as 32P labeled probe. In supershift assays an antibody directed against HNF4α (+) was added. Binding of HNF4α was significantly increased after 72 h of Aroclor1254 induction.

Similar articles

Cited by

References

    1. Schrem H, Klempnauer J, Borlak J. Liver-enriched transcription factors in liver function and development. Part I: the hepatocyte nuclear factor network and liver-specific gene expression. Pharmacol Rev. 2002;54:129–158. - PubMed
    1. Jiang G, Lee U, Sladek FM. Proposed mechanism for the stabilization of nuclear receptor DNA binding via protein dimerization. Mol Cell Biol. 1997;17:6546–6554. - PMC - PubMed
    1. Rada-Iglesias A, Wallerman O, Koch C, Ameur A, Enroth S, et al. Binding sites for metabolic disease related transcription factors inferred at base pair resolution by chromatin immunoprecipitation and genomic microarrays. Hum Mol Genet. 2005;14:3435–3447. - PubMed
    1. Odom DT, Zizlsperger N, Gordon DB, Bell GW, Rinaldi NJ, et al. Control of pancreas and liver gene expression by HNF transcription factors. Science. 2004;303:1378–1381. - PMC - PubMed
    1. Delie F, Rubas W. A human colonic cell line sharing similarities with enterocytes as a model to examine oral absorption: advantages and limitations of the Caco-2 model. Crit Rev Ther Drug Carrier Syst. 1997;14:221–286. - PubMed

Publication types

MeSH terms