. 2011 Jul 31;29(8):742-9.
doi: 10.1038/nbt.1914.

Transcriptome sequencing across a prostate cancer cohort identifies PCAT-1, an unannotated lincRNA implicated in disease progression

Affiliations

Transcriptome sequencing across a prostate cancer cohort identifies PCAT-1, an unannotated lincRNA implicated in disease progression

John R Prensner et al. Nat Biotechnol. .

Abstract

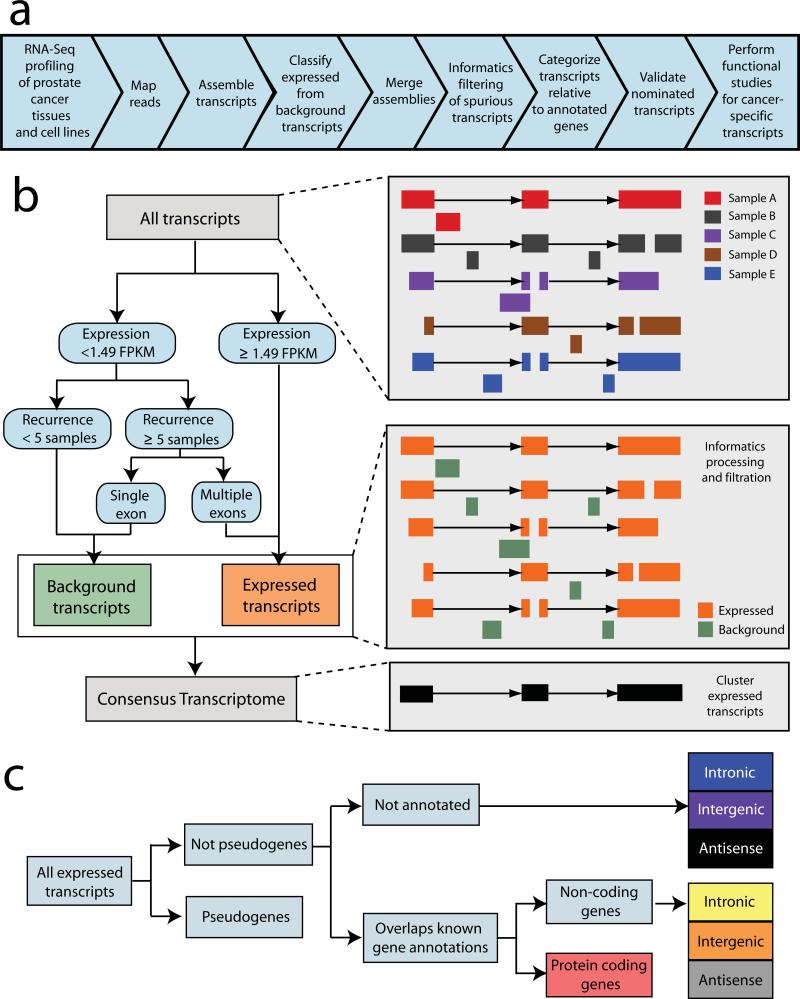
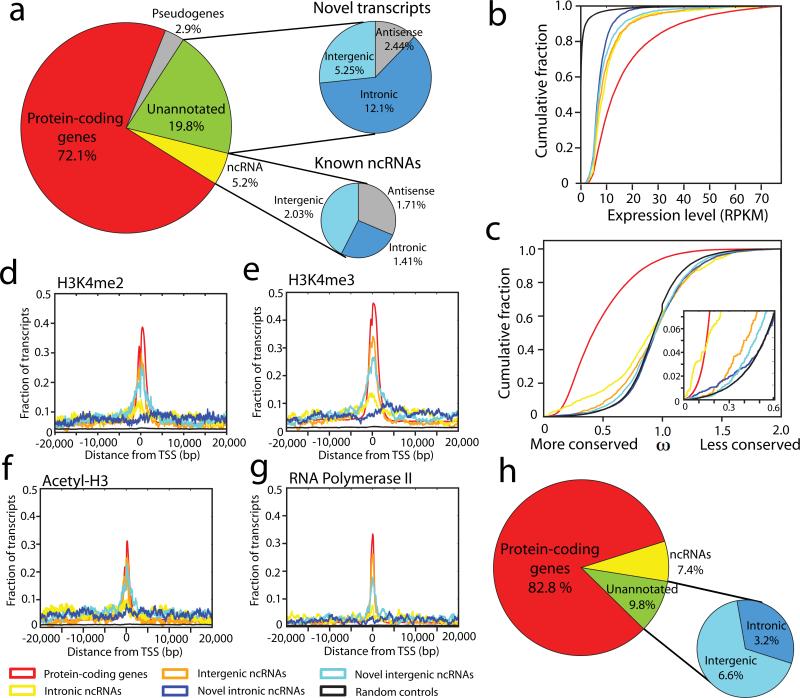
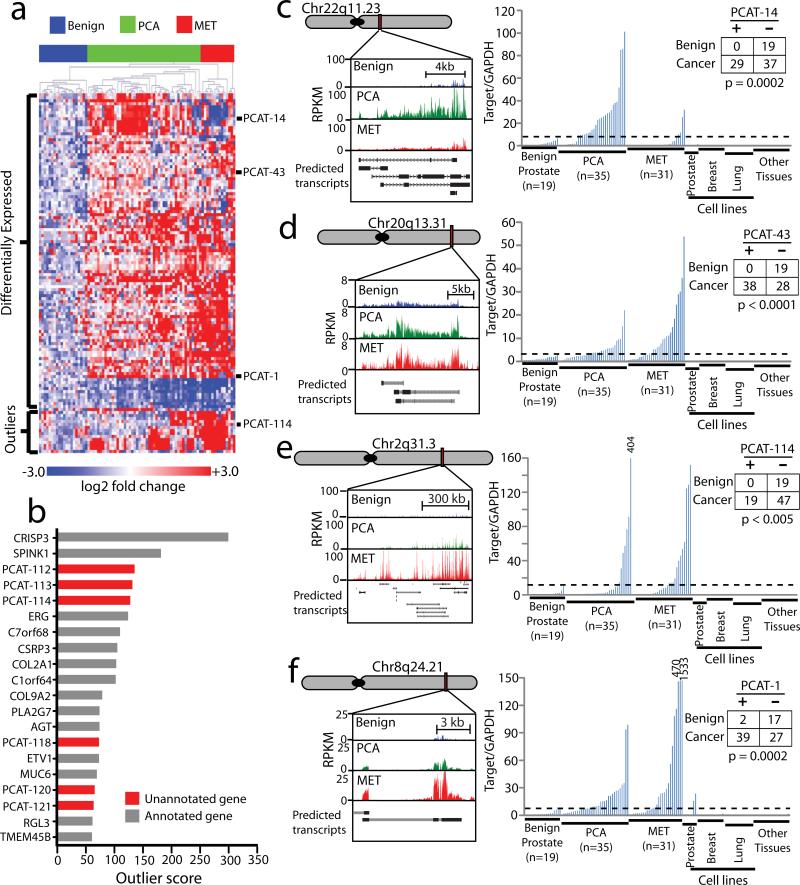
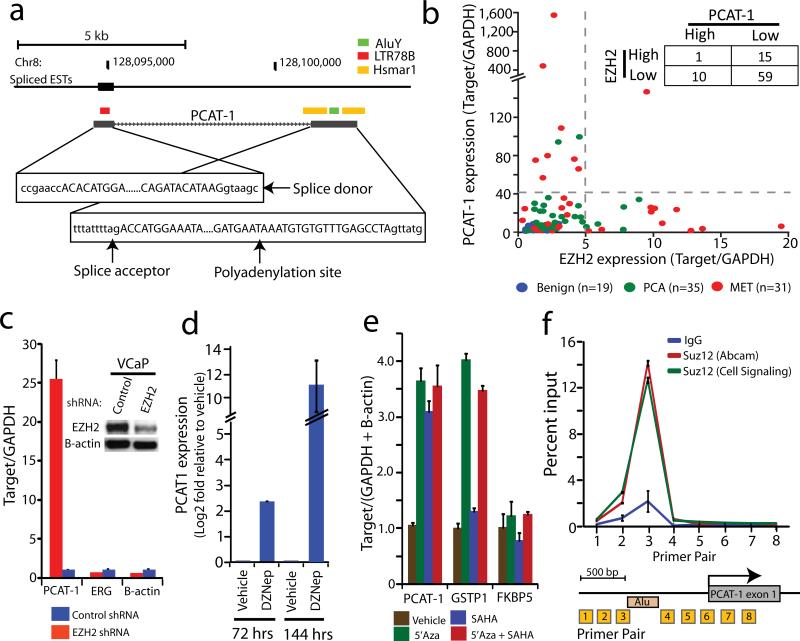
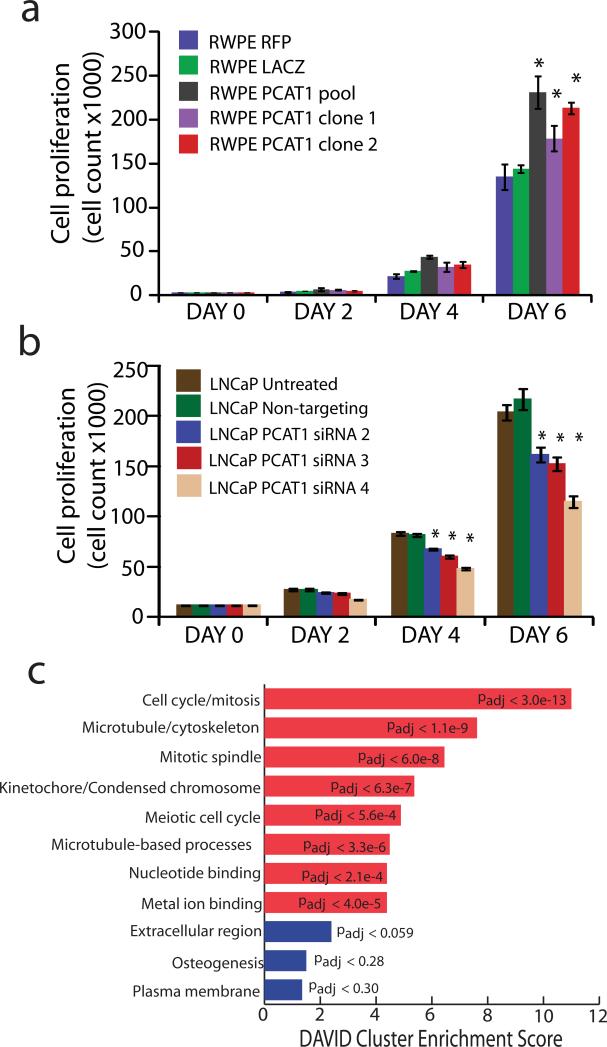
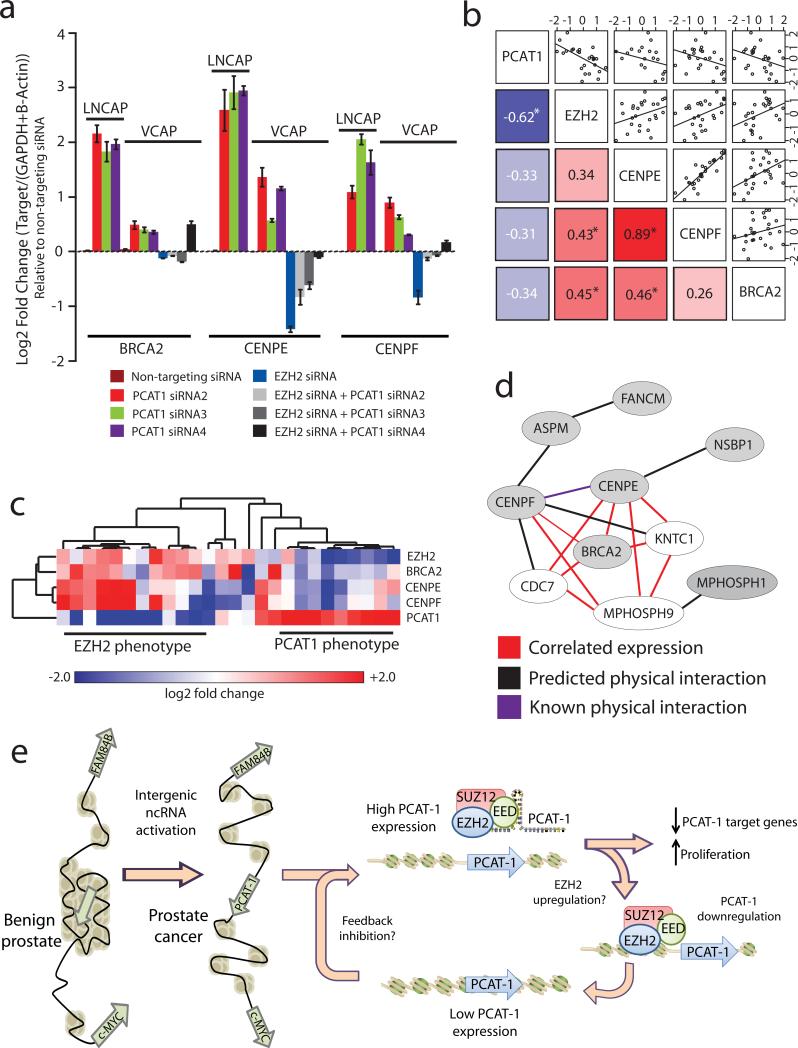
Noncoding RNAs (ncRNAs) are emerging as key molecules in human cancer, with the potential to serve as novel markers of disease and to reveal uncharacterized aspects of tumor biology. Here we discover 121 unannotated prostate cancer-associated ncRNA transcripts (PCATs) by ab initio assembly of high-throughput sequencing of polyA(+) RNA (RNA-Seq) from a cohort of 102 prostate tissues and cells lines. We characterized one ncRNA, PCAT-1, as a prostate-specific regulator of cell proliferation and show that it is a target of the Polycomb Repressive Complex 2 (PRC2). We further found that patterns of PCAT-1 and PRC2 expression stratified patient tissues into molecular subtypes distinguished by expression signatures of PCAT-1-repressed target genes. Taken together, our findings suggest that PCAT-1 is a transcriptional repressor implicated in a subset of prostate cancer patients. These findings establish the utility of RNA-Seq to identify disease-associated ncRNAs that may improve the stratification of cancer subtypes.


Figures

Figure 1
Figure 1. Analysis of transcriptome data for the detection of unannotated transcripts
(a) A schematic overview of the methodology employed in this study. (b) A graphical representation showing the bioinformatics filtration model used to merge individual transcriptome libraries into a single consensus transcriptome. The merged consensus transcriptome was generated by compiling all individual transcriptome libraries and using a decision tree classifier in order to define high confidence “expressed” transcripts and low confidence “background” transcripts, which were discarded. The example decision tree on the left was produced from transcripts on chromosome 1. The graphics on the right provide a fictional example demonstrating the informatics filtration pipelin e . (c) Following informatic processing and filtration of the sequencing data, transcripts were categorized in order to identify unannotated ncRNAs. Transcribed pseudogenes were isolated, and the remaining transcripts were categorized based on overlap with an aggregated set of known gene annotations into annotated protein coding, non-coding, and unannotated. Both annotated and unannotated ncRNA transcripts were then separated into intronic, intergenic, and antisense categories based on their relationship to protein coding genes.
Figure 2
Figure 2. Prostate cancer transcriptome sequencing reveals dysregulation of novel transcripts
(a) A global overview of transcription in prostate cancer. The left pie chart displays transcript distribution in prostate cancer. The upper and lower right pie charts display unannotated or annotated ncRNAs, respectively categorized as sense transcripts (intergenic and intronic) and antisense transcripts. (b) A line graph showing that unannotated transcripts are more highly expressed (RPKM) than control regions. Negative control intervals were generated by randomly permuting the genomic positions of the transcripts. (c) Conservation analysis comparing unannotated transcripts to known genes and intronic controls shows a subtle degree of purifying selection among unannotated transcripts. The insert on the right shows an enlarged view. (d-g) Intersection plots displaying the fraction of unannotated transcripts enriched for H3K4me2 (d), H3K4me3 (e), Acetyl-H3 (f) or RNA polymerase II (g) at their transcriptional start site (TSS) using ChIP-Seq and RNA-Seq data for the VCaP prostate cancer cell line. The legend for these plots (b-g) is shared and located below (f) and (g). (h) A pie chart displaying the distribution of differentially expressed transcripts in prostate cancer (FDR < 0.01).
Figure 3
Figure 3. Unannotated intergenic transcripts differentiate prostate cancer and benign prostate samples
(a) Unsupervised clustering analyses of differentially-expressed or outlier unannotated intergenic transcripts clusters benign samples, localized tumors, and metastatic cancers. Expression is plotted as log2 fold change relative to the median of the benign samples. The four transcripts detailed in this study are indicated on the side. (b) Cancer outlier expression analysis for the prostate cancer transcriptome ranks unannotated transcripts prominently. (c-f) qPCR on an independent cohort of prostate and non-prostate samples (Benign (n=19), PCA (n=35), MET (n=31), prostate cell lines (n=7), breast cell lines (n=14), lung cell lines (n=16), other normal samples (n=19), see Supplementary Table 8) measures expression levels of four nominated ncRNAs—PCAT-1, PCAT-43, PCAT-114, and PCAT-14—upregulated in prostate cancer. Inset tables on the right quantify “positive” and “negative” expressing samples using the cut-off value (shown as a black dotted line). Statistical significance was determined using a Fisher's exact test. (c) PCAT-14. (d) PCAT-43. (e) PCAT-114 (SChLAP1). (f) PCAT-1. qPCR analysis was performed by normalizing to GAPDH and the median expression of the benign samples.
Figure 4
Figure 4. PCAT-1 is a marker of aggressive cancer and a PRC2-repressed ncRNA
(a) The genomic location of PCAT-1 determined by 5’ and 3’ RACE, with DNA sequence features indicated by the colored boxes (b) qPCR for PCAT-1 (Y-axis) and EZH2 (X-axis) on a cohort of benign (n=19), localized tumor (n=35) and metastatic cancer (n=31) samples. The inset table quantifies patient subsets demarcated by the gray dotted lines. (c) Knockdown of EZH2 in VCaP resulted in upregulation of PCAT-1. Data were normalized to GAPDH and represented as fold change. ERG and B-Actin serve as negative controls. The inset Western blot indicates EZH2 knockdown. (d) Treatment of VCaP cells with 0.1 μM of the EZH2 inhibitor DZNep or vehicle control (DMSO) shows increased expression of PCAT-1 transcript following EZH2 inhibition. (e) PCAT-1 expression is increased upon treatment of VCaP cells with the demethylating agent 5’Azacytidine, the histone deacetylase inhibitor SAHA, or a combination of both. qPCR data were normalized to the average of (GAPDH+B-Actin) and represented as fold change. GSTP1 and FKBP5 are positive and negative controls, respectively. (f) ChIP assays for SUZ12 demonstrated direct binding of SUZ12 to the PCAT-1 promoter. Primer locations are indicated (boxed numbers) in the PCAT-1 schematic.
Figure 5
Figure 5. PCAT-1 promotes cell proliferation
(a) Cell proliferation assays for RWPE benign immortalized prostate cells stably infected with PCAT-1 lentivirus or RFP and LacZ control lentiviruses. An asterisk (*) indicates p ≤ 0.02 by a two-tailed Students t-test. (b) Cell proliferation assays in LNCaP using PCAT-1 siRNAs. An asterisk (*) indicates p ≤ 0.005 by a two-tailed Students t-test. (c) Gene ontology analysis of PCAT-1 knockdown microarray data using the DAVID program. Blue bars represent the top hits for upregulated genes. Red bars represent the top hits for downregulated genes. All error bars in this figure are mean ± S.E.M.
Figure 6
Figure 6. Prostate cancer tissues recapitulate PCAT-1 signaling
(a) qPCR expression of three PCAT-1 target genes after PCAT-1 knockdown in VCaP and LNCaP cells, as well as following EZH2 knockdown or dual EZH2 and PCAT-1 knockdown in VCaP cells. qPCR data were normalized to the average of (GAPDH+B-Actin) and represented as fold change. Error bars represent mean ± S.E.M. (b) Standardized log2-transformed qPCR expression of a set of tumors and metastases with outlier expression of either PCAT-1 or EZH2. The shaded squares in the lower left show Spearman correlation values between the indicated genes (* indicates p < 0.05). Blue and red indicate negative or positive correlation, respectively. The upper squares show the scatter plot matrix and fitted trendlines for the same comparisons. (c) A heatmap of PCAT-1 target genes (BRCA2, CENPF, CENPE) in EZH2-outlier and PCAT-1-outlier patient samples (see Fig. 4b). Expression was determined by qPCR and normalized as in (b). (d) A predicted network generated by the HefaLMP program for 7 of 20 top upregulated genes following PCAT-1 knockdown in LNCaP cells. Gray nodes are genes found following PCAT-1 knockdown. Red edges indicate co-expressed genes; black edges indicate predicted protein-protein interactions; and purple edges indicate verified protein-protein interactions. (e) A proposed schematic representing PCAT-1 upregulation, function, and relationship to PRC2.

Similar articles

Cited by

References

    1. Metzker ML. Sequencing technologies - the next generation. Nat Rev Genet. 2010;11:31–46. - PubMed
    1. Guttman M, et al. Ab initio reconstruction of cell type-specific transcriptomes in mouse reveals the conserved multi-exonic structure of lincRNAs. Nat Biotechnol. 2010;28:503–510. - PMC - PubMed
    1. Trapnell C, et al. Transcript assembly and quantification by RNA-Seq reveals unannotated transcripts and isoform switching during cell differentiation. Nat Biotechnol. 2010;28:511–515. - PMC - PubMed
    1. Robertson G, et al. De novo assembly and analysis of RNA-seq data. Nat Methods. 2010;7:909–912. - PubMed
    1. Zerbino DR, Birney E. Velvet: algorithms for de novo short read assembly using de Bruijn graphs. Genome Res. 2008;18:821–829. - PMC - PubMed

Publication types

MeSH terms

Associated data