Clustering of GLUT4, TUG, and RUVBL2 protein levels correlate with myosin heavy chain isoform pattern in skeletal muscles, but AS160 and TBC1D1 levels do not
- PMID: 21799128
- PMCID: PMC3191788
- DOI: 10.1152/japplphysiol.00631.2011
Clustering of GLUT4, TUG, and RUVBL2 protein levels correlate with myosin heavy chain isoform pattern in skeletal muscles, but AS160 and TBC1D1 levels do not
Abstract
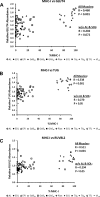
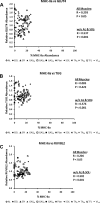
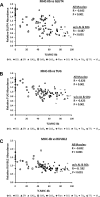
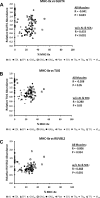
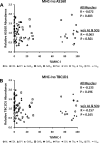
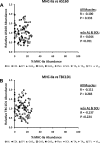
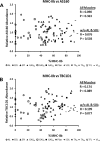
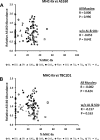
Skeletal muscle is a heterogeneous tissue. To further elucidate this heterogeneity, we probed relationships between myosin heavy chain (MHC) isoform composition and abundance of GLUT4 and four other proteins that are established or putative GLUT4 regulators [Akt substrate of 160 kDa (AS160), Tre-2/Bub2/Cdc 16-domain member 1 (TBC1D1), Tethering protein containing an UBX-domain for GLUT4 (TUG), and RuvB-like protein two (RUVBL2)] in 12 skeletal muscles or muscle regions from Wistar rats [adductor longus, extensor digitorum longus, epitrochlearis, gastrocnemius (mixed, red, and white), plantaris, soleus, tibialis anterior (red and white), tensor fasciae latae, and white vastus lateralis]. Key results were 1) significant differences found among the muscles (range of muscle expression values) for GLUT4 (2.5-fold), TUG (1.7-fold), RUVBL2 (2.0-fold), and TBC1D1 (2.7-fold), but not AS160; 2) significant positive correlations for pairs of proteins: GLUT4 vs. TUG (R = 0.699), GLUT4 vs. RUVBL2 (R = 0.613), TUG vs. RUVBL2 (R = 0.564), AS160 vs. TBC1D1 (R = 0.293), and AS160 vs. TUG (R = 0.246); 3) significant positive correlations for %MHC-I: GLUT4 (R = 0.460), TUG (R = 0.538), and RUVBL2 (R = 0.511); 4) significant positive correlations for %MHC-IIa: GLUT4 (R = 0.293) and RUVBL2 (R = 0.204); 5) significant negative correlations for %MHC-IIb vs. GLUT4 (R = -0.642), TUG (R = -0.626), and RUVBL2 (R = -0.692); and 6) neither AS160 nor TBC1D1 significantly correlated with MHC isoforms. In 12 rat muscles, GLUT4 abundance tracked with TUG and RUVBL2 and correlated with MHC isoform expression, but was unrelated to AS160 or TBC1D1. Our working hypothesis is that some of the mechanisms that regulate GLUT4 abundance in rat skeletal muscle also influence TUG and RUVBL2 abundance.
Figures


Similar articles
-
Fiber type effects on contraction-stimulated glucose uptake and GLUT4 abundance in single fibers from rat skeletal muscle.Am J Physiol Endocrinol Metab. 2015 Feb 1;308(3):E223-30. doi: 10.1152/ajpendo.00466.2014. Epub 2014 Dec 9. Am J Physiol Endocrinol Metab. 2015. PMID: 25491725 Free PMC article.
-
Increased AS160 phosphorylation, but not TBC1D1 phosphorylation, with increased postexercise insulin sensitivity in rat skeletal muscle.Am J Physiol Endocrinol Metab. 2009 Jul;297(1):E242-51. doi: 10.1152/ajpendo.00194.2009. Epub 2009 May 12. Am J Physiol Endocrinol Metab. 2009. PMID: 19435856 Free PMC article.
-
Heterogeneous effects of calorie restriction on in vivo glucose uptake and insulin signaling of individual rat skeletal muscles.PLoS One. 2013 Jun 3;8(6):e65118. doi: 10.1371/journal.pone.0065118. Print 2014. PLoS One. 2013. PMID: 23755179 Free PMC article.
-
A proteolytic pathway that controls glucose uptake in fat and muscle.Rev Endocr Metab Disord. 2014 Mar;15(1):55-66. doi: 10.1007/s11154-013-9276-2. Rev Endocr Metab Disord. 2014. PMID: 24114239 Free PMC article. Review.
-
Exercise and insulin: Convergence or divergence at AS160 and TBC1D1?Exerc Sport Sci Rev. 2009 Oct;37(4):188-95. doi: 10.1097/JES.0b013e3181b7b7c5. Exerc Sport Sci Rev. 2009. PMID: 19955868 Free PMC article. Review.
Cited by
-
Discovery of a novel cardiac-specific myosin modulator using artificial intelligence-based virtual screening.Nat Commun. 2023 Nov 24;14(1):7692. doi: 10.1038/s41467-023-43538-y. Nat Commun. 2023. PMID: 38001148 Free PMC article.
-
Type IIx muscle fibers are related to poor body composition, glycemic and lipidemic blood profiles in young females: the protective role of type I and IIa muscle fibers.Eur J Appl Physiol. 2024 Feb;124(2):585-594. doi: 10.1007/s00421-023-05302-4. Epub 2023 Sep 1. Eur J Appl Physiol. 2024. PMID: 37656281
-
Muscle p62 stimulates the expression of antioxidant proteins alleviating cancer cachexia.FASEB J. 2023 Sep;37(9):e23156. doi: 10.1096/fj.202300349R. FASEB J. 2023. PMID: 37624620 Free PMC article.
-
Greater Phosphorylation of AMPK and Multiple AMPK Substrates in the Skeletal Muscle of 24-Month-Old Calorie Restricted Compared to Ad-Libitum Fed Male Rats.J Gerontol A Biol Sci Med Sci. 2023 Feb 24;78(2):177-185. doi: 10.1093/gerona/glac218. J Gerontol A Biol Sci Med Sci. 2023. PMID: 36269629 Free PMC article.
-
Ubiquitin-like processing of TUG proteins as a mechanism to regulate glucose uptake and energy metabolism in fat and muscle.Front Endocrinol (Lausanne). 2022 Sep 29;13:1019405. doi: 10.3389/fendo.2022.1019405. eCollection 2022. Front Endocrinol (Lausanne). 2022. PMID: 36246906 Free PMC article. Review.
References
-
- Allaf O, Goubel F, Marini JF. A curve-fitting procedure to explain changes in muscle force-velocity relationship induced by hyperactivity. J Biomech 35: 797–802, 2002 - PubMed
-
- Ariano MA, Armstrong RB, Edgerton VR. Hindlimb muscle fiber populations of five mammals. J Histochem Cytochem 21: 51–55, 1973 - PubMed
-
- Benton CR, Holloway GP, Han XX, Yoshida Y, Snook LA, Lally J, Glatz JF, Luiken JJ, Chabowski A, Bonen A. Increased levels of peroxisome proliferator-activated receptor gamma, coactivator 1 alpha (PGC-1alpha) improve lipid utilisation, insulin signaling and glucose transport in skeletal muscle of lean and insulin-resistant obese Zucker rats. Diabetologia 53: 2008–2019, 2010 - PubMed
-
- Bogan JS, Hendon N, McKee AE, Tsao TS, Lodish HF. Functional cloning of TUG as a regulator of GLUT4 glucose transporter trafficking. Nature 425: 727–733, 2003 - PubMed
Publication types
MeSH terms
Substances
Grants and funding
LinkOut - more resources
Full Text Sources
Research Materials
Miscellaneous

