Duration of antigen availability influences the expansion and memory differentiation of T cells
- PMID: 21775679
- PMCID: PMC3159832
- DOI: 10.4049/jimmunol.1100363
Duration of antigen availability influences the expansion and memory differentiation of T cells
Abstract
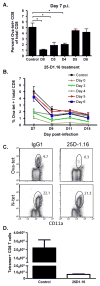
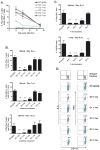
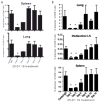
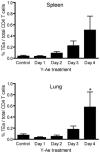
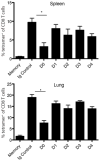
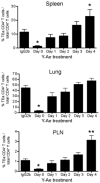
The initial engagement of the TCR through interaction with cognate peptide-MHC is a requisite for T cell activation and confers Ag specificity. Although this is a key event in T cell activation, the duration of these interactions may affect the proliferative capacity and differentiation of the activated cells. In this study, we developed a system to evaluate the temporal requirements for antigenic stimulation during an immune response in vivo. Using Abs that target specific Ags in the context of MHC, we were able to manipulate the duration of Ag availability to both CD4 and CD8 T cells during an active infection. During the primary immune response, the magnitude of the CD4 and CD8 T cell response was dependent on the duration of Ag availability. Both CD4 and CD8 T cells required sustained antigenic stimulation for maximal expansion. Memory cell differentiation was also dependent on the duration of Ag exposure, albeit to a lesser extent. However, memory development did not correlate with the magnitude of the primary response, suggesting that the requirements for continued expansion of T cells and memory differentiation are distinct. Finally, a shortened period of Ag exposure was sufficient to achieve optimal expansion of both CD4 and CD8 T cells during a recall response. It was also revealed that limiting exposure to Ag late during the response may enhance the CD4 T cell memory pool. Collectively, these data indicated that Ag remains a critical component of the T cell response after the initial APC-T cell interaction.
Figures



Similar articles
-
Cognate memory CD4+ T cells generated with dendritic cell priming influence the expansion, trafficking, and differentiation of secondary CD8+ T cells and enhance tumor control.J Immunol. 2007 Nov 1;179(9):5829-38. doi: 10.4049/jimmunol.179.9.5829. J Immunol. 2007. PMID: 17947656
-
Differential kinetics of antigen dependency of CD4+ and CD8+ T cells.J Immunol. 2014 Apr 15;192(8):3507-17. doi: 10.4049/jimmunol.1302725. Epub 2014 Mar 17. J Immunol. 2014. PMID: 24639353
-
Direct CD4 help provision following interaction of memory CD4 and CD8 T cells with distinct antigen-presenting dendritic cells.J Immunol. 2010 Jul 15;185(2):1028-36. doi: 10.4049/jimmunol.0904209. Epub 2010 Jun 18. J Immunol. 2010. PMID: 20562265
-
Virus-specific CD8 T cells: activation, differentiation and memory formation.APMIS. 2009 May;117(5-6):356-81. doi: 10.1111/j.1600-0463.2009.02459.x. APMIS. 2009. PMID: 19400862 Review.
-
Influencing the fates of CD4 T cells on the path to memory: lessons from influenza.Immunol Cell Biol. 2008 May-Jun;86(4):343-52. doi: 10.1038/icb.2008.13. Epub 2008 Mar 25. Immunol Cell Biol. 2008. PMID: 18362946 Review.
Cited by
-
Epitope-Specific Vaccination Limits Clonal Expansion of Heterologous Naive T Cells during Viral Challenge.Cell Rep. 2016 Oct 11;17(3):636-644. doi: 10.1016/j.celrep.2016.09.019. Cell Rep. 2016. PMID: 27732841 Free PMC article.
-
Peptide-based anticancer vaccines: The making and unmaking of a T-cell graveyard.Oncoimmunology. 2013 Jul 1;2(7):e24743. doi: 10.4161/onci.24743. Epub 2013 Apr 30. Oncoimmunology. 2013. PMID: 24073366 Free PMC article.
-
Chemokine guidance of central memory T cells is critical for antiviral recall responses in lymph nodes.Cell. 2012 Sep 14;150(6):1249-63. doi: 10.1016/j.cell.2012.08.015. Cell. 2012. PMID: 22980984 Free PMC article.
-
Short-Lived Antigen Recognition but Not Viral Infection at a Defined Checkpoint Programs Effector CD4 T Cells To Become Protective Memory.J Immunol. 2016 Nov 15;197(10):3936-3949. doi: 10.4049/jimmunol.1600838. Epub 2016 Oct 17. J Immunol. 2016. PMID: 27798159 Free PMC article.
-
Immune response effects of diverse vaccine antigen attachment ways based on the self-made nanoemulsion adjuvant in systemic MRSA infection.RSC Adv. 2018 Mar 14;8(19):10425-10436. doi: 10.1039/c8ra00154e. eCollection 2018 Mar 13. RSC Adv. 2018. PMID: 35540467 Free PMC article.
References
-
- Kaech SM, Hemby S, Kersh E, Ahmed R. Molecular and functional profiling of memory CD8 T cell differentiation. Cell. 2002;111:837–851. - PubMed
-
- Monks CR, Freiberg BA, Kupfer H, Sciaky N, Kupfer A. Three-dimensional segregation of supramolecular activation clusters in T cells. Nature. 1998;395:82–86. - PubMed
-
- Grakoui A, Bromley SK, Sumen C, Davis MM, Shaw AS, Allen PM, Dustin ML. The immunological synapse: a molecular machine controlling T cell activation. Science. 1999;285:221–227. - PubMed
-
- Van Stipdonk MJ, Lemmens EE, Schoenberger SP. Naive CTLs require a single brief period of antigenic stimulation for clonal expansion and differentiation. Nat Immunol. 2001;2:423–429. - PubMed
Publication types
MeSH terms
Substances
Grants and funding
- R01 AI042858/AI/NIAID NIH HHS/United States
- AI76457/AI/NIAID NIH HHS/United States
- P01 AI056172/AI/NIAID NIH HHS/United States
- P01 AI056172-07/AI/NIAID NIH HHS/United States
- P01 AI56172/AI/NIAID NIH HHS/United States
- R01 AI076457-04/AI/NIAID NIH HHS/United States
- AI42858/AI/NIAID NIH HHS/United States
- AI41576/AI/NIAID NIH HHS/United States
- R01 AI076457/AI/NIAID NIH HHS/United States
- T32 AI007080/AI/NIAID NIH HHS/United States
- T32 AI07080/AI/NIAID NIH HHS/United States
- R01 AI041576-15/AI/NIAID NIH HHS/United States
- R01 AI041576/AI/NIAID NIH HHS/United States
LinkOut - more resources
Full Text Sources
Other Literature Sources
Research Materials

