. 2011 Aug;17(8):1529-43.
doi: 10.1261/rna.2775511. Epub 2011 Jun 27.

microRNA-Seq reveals cocaine-regulated expression of striatal microRNAs

Affiliations

microRNA-Seq reveals cocaine-regulated expression of striatal microRNAs

Jodi E Eipper-Mains et al. RNA. 2011 Aug.

Abstract

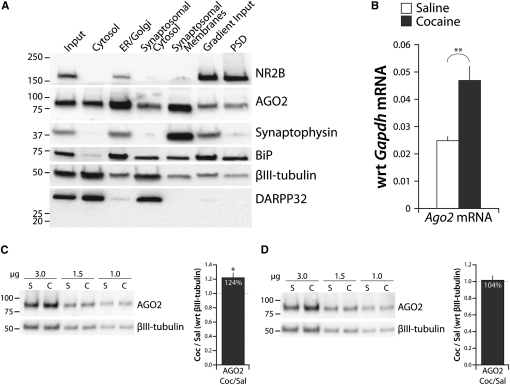
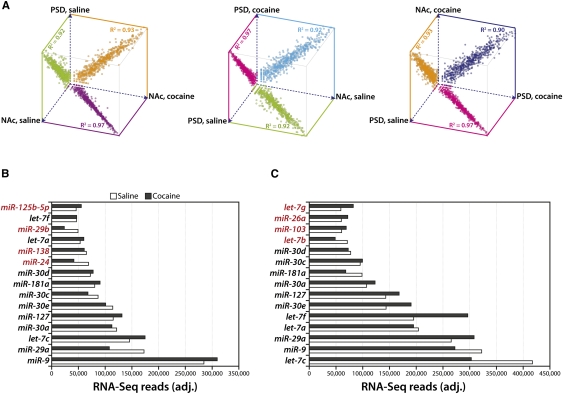
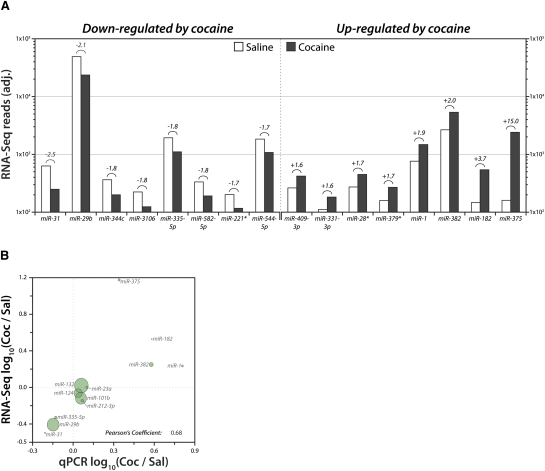
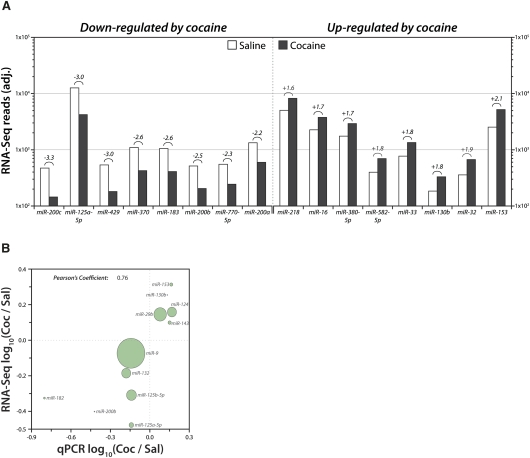
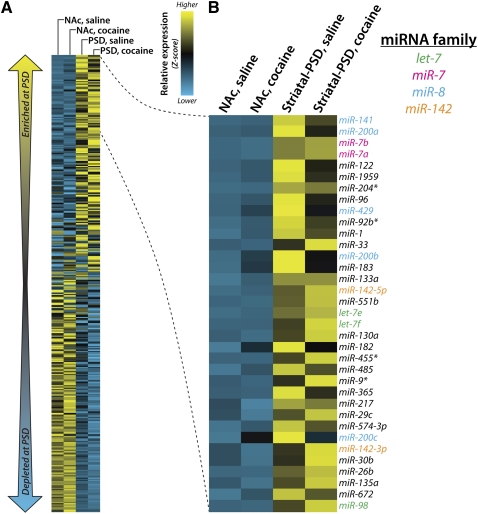
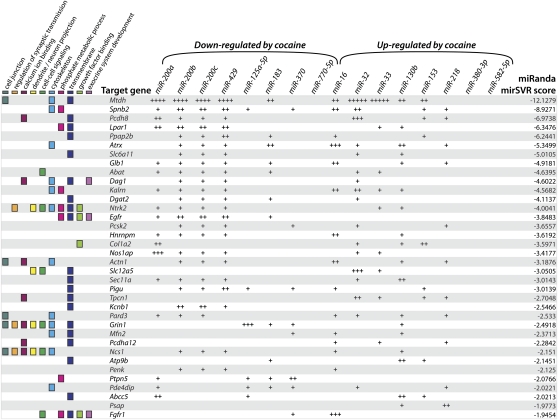
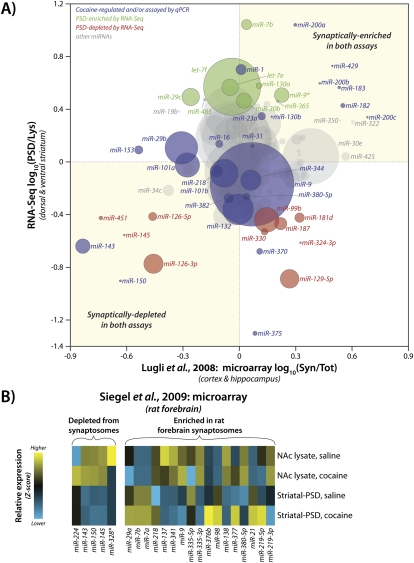
MicroRNAs (miRNAs) are small RNAs that modulate gene expression by binding target mRNAs. The hundreds of miRNAs expressed in the brain are critical for synaptic development and plasticity. Drugs of abuse cause lasting changes in the limbic regions of the brain that process reward, and addiction is viewed as a form of aberrant neuroplasticity. Using next-generation sequencing, we cataloged miRNA expression in the nucleus accumbens and at striatal synapses in control and chronically cocaine-treated mice. We identified cocaine-responsive miRNAs, synaptically enriched and depleted miRNA families, and confirmed cocaine-induced changes in protein expression for several predicted synaptic target genes. The miR-8 family, known for its roles in cancer, is highly enriched and cocaine regulated at striatal synapses, where its members may affect expression of cell adhesion molecules. Synaptically enriched cocaine-regulated miRNAs may contribute to long-lasting drug-induced plasticity through fine-tuning regulatory pathways that modulate the actin cytoskeleton, neurotransmitter metabolism, and peptide hormone processing.


Figures

FIGURE 1.
FIGURE 1.
Subcellular fractionation. (A) Wild-type mouse striata were subjected to subcellular fractionation. Aliquots containing equal amounts of protein (10 μg; 5 μg, PSD) were fractionated by SDS-PAGE, transferred, and analyzed by Western blot. NR2B, AGO2, and Synaptophysin were visualized from one gel; BiP, βIII-tubulin, and DARPP32 were visualized from an identical gel. PSD, post-synaptic density. (B) Total NAc RNA from adult male mice treated with saline or cocaine (four per group) was analyzed by qPCR; Ago2 mRNA expression was normalized to Gapdh. (C,D) PSDs purified from the striata (C) and prefrontal cortices (PFCs) (D) of saline (S)- and cocaine (C)-treated mice were fractionated by SDS-PAGE. AGO2 levels were normalized to βIII-tubulin by densitometry for the varying amounts of protein loaded; plot shows average C/S ratio for AGO2. Significance was tested by the two-tailed Student's t-test with unequal (B) or equal (C,D) variance. *P < 0.05; **P < 0.01.
FIGURE 2.
FIGURE 2.
High-throughput sequence analysis of NAc and PSD miRNA. (A) Pairwise scatter plots of miRNA expression data for NAc lysate and striatal PSD libraries (saline and cocaine) prepared from an adult mouse; shown as log10(normalized miRNA frequency) per sample. R2 values were calculated by least squares best fit. Expression data for the 15 most abundant miRNAs in NAc lysates (B) and striatal PSDs (C) are shown as reads (adjusted for equal total reads per sample). The miRNAs in black italics are highly expressed in both NAc and PSD; miRNAs in red italics are highly expressed only in that sample.
FIGURE 3.
FIGURE 3.
Cocaine-regulated miRNAs in NAc total lysates. (A) NAc lysate libraries (saline and cocaine) analyzed by high-throughput sequencing of miRNAs. The eight most cocaine down- and up-regulated miRNAs detected at >100 reads are shown as adjusted reads (equal total reads per sample) on log10 scale. The number above the bars indicates fold change. (B) Pairwise scatter plot comparing log10 ratio of Coc/Sal expression for selected miRNAs in NAc tissue lysate as computed from RNA-Seq data (vertical axis) and qPCR data (horizontal axis). Size of circle is proportional to average RNA-Seq expression value. Pearson's Coefficient represents the linear correlation coefficient, r.
FIGURE 4.
FIGURE 4.
Cocaine-regulated miRNAs in striatal PSDs. (A) Striatal PSD libraries (saline and cocaine) analyzed by high-throughput sequencing of miRNAs. The eight most cocaine down- and up-regulated miRNAs detected at >100 reads are shown as adjusted reads as described in Fig. 3. (B) Pairwise scatter plot comparing log10 ratio of Coc/Sal expression for selected miRNAs in striatal PSDs as computed from RNA-Seq data (vertical axis) and qPCR data (horizontal axis) as described in Fig. 3.
FIGURE 5.
FIGURE 5.
Identification of miRNA families enriched at the PSD. (A) Normalized miRNA frequency data for saline- and cocaine-treated NAc lysate and striatal PSD libraries of wild-type mice were calculated; heat map is sorted by decreasing average PSD frequency/NAc frequency ratio. Z-score was computed on normalized miRNA frequency across all samples. Blue indicates low expression and yellow indicates high expression. (B) Expansion of heat map showing top PSD-enriched miRNAs. Text color indicates miRNA families with two or more family members appearing in the list.
FIGURE 6.
FIGURE 6.
Target prediction for cocaine-regulated miRNAs. The 16 most cocaine-regulated striatal PSD miRNAs from Fig. 4 were subjected to bioinformatic target prediction using miRanda. The list of potential target mRNAs was cross-referenced with the 424 PSD-enriched mRNAs identified by Suzuki et al. (2007) (Supplemental Table S2) and sorted by ascending mirSVR score. + symbols show presence of predicted miRNA binding site in 3′ UTR of target gene; number of + signs denotes number of predicted miRNA binding sites. The 36 target genes shown were run through gene ontology analysis using DAVID; colored boxes indicate enriched gene ontological functions with P < 0.05.
FIGURE 7.
FIGURE 7.
Validation of target predictions. PSDs purified from the striata of saline (S)- and cocaine (C)-treated mice were fractionated by SDS-PAGE; three different amounts of protein were analyzed to establish response linearity. Levels for pan-TRK (A); ECAD (➄) and Metadherin (MTDH) (B); and PC2 (➄), proPC2 (➄), and preproPC2 (←) (C) were normalized to βIII-tubulin by densitometry for the varying amounts of protein loaded; plot shows average C/S ratio. Based on published reports, the higher molecular weight band (∼120 kDa) above the major 105 kDa ECAD band corresponds to the precursor, proECAD (➄) (Miyashita and Ozawa 2007; van Roy and Berx 2008). For PC2, the smaller molecular weight band represents mature PC2 (➄), the middle band represents proPC2 (➄), and the upper band is the size of preproPC2 (←) (Bloomquist et al. 1991). Schematic drawings represent mRNAs of indicated genes; open reading frame (ORF) is gray, 3′ UTR is striped, arrowheads show miRanda predicted miRNA binding sites for miRNAs up-regulated (▴) or down-regulated (▾) after cocaine at PSD. Significance was tested by the two-tailed Student's t-test with equal variance. *P < 0.05; **P < 0.01. Error bars represent the standard deviation (SD).
FIGURE 8.
FIGURE 8.
Comparison of data for striatum and cortex/hippocampus. (A) Pairwise scatter plot comparing miRNA synaptic enrichment ratios from Lugli et al. 2008 (adult mouse cortex and hippocampus; measured by microarray) with RNA-Seq data (adult mouse striatum) from these experiments (Lugli et al. 2008). Horizontal axis, data from Lugli et al. 2008 computed as ratio of PSD (Syn)/total tissue (Tot) expression; vertical axis, data from RNA-Seq computed as PSD/NAc lysate ratio of average of saline and cocaine expression levels for adult mouse striatal PSD and NAc lysate. Blue circles were identified as cocaine-regulated and/or were assayed by qPCR, green circles indicate miRNAs enriched at striatal PSDs by RNA-Seq, red circles indicate miRNAs depleted at striatal PSDs by RNA-Seq, and gray circles represent all other miRNAs. Size of circle is proportional to average RNA-Seq expression value. (B) Synaptosomal enrichment and depletion categories for miRNAs from Siegel et al. 2009 as determined by microarray analysis of rat forebrain samples (Siegel et al. 2009). Heat map shows high-throughput sequencing data for saline- and cocaine-treated NAc lysates and striatal PSDs of wild-type mice; normalized miRNA frequency was calculated and Z-score was computed on normalized miRNA frequency across all samples. Blue indicates low expression and yellow indicates high expression.

Similar articles

Cited by

References

    1. Betel D, Wilson M, Gabow A, Marks DS, Sander C 2008. The microRNA.org resource: targets and expression. Nucleic Acids Res 36: D149–D153 - PMC - PubMed
    1. Betel D, Koppal A, Agius P, Sander C, Leslie C 2010. Comprehensive modeling of microRNA targets predicts functional non-conserved and non-canonical sites. Genome Biol 11: R90 doi: 10.1186/gb-2010-11-8-r90 - PMC - PubMed
    1. Beveridge NJ, Gardiner E, Carroll AP, Tooney PA, Cairns MJ 2010. Schizophrenia is associated with an increase in cortical microRNA biogenesis. Mol Psychiatry 15: 1176–1189 - PMC - PubMed
    1. Bloomquist BT, Eipper BA, Mains RE 1991. Prohormone-converting enzymes: regulation and evaluation of function using antisense RNA. Mol Endocrinol 5: 2014–2024 - PubMed
    1. Burmistrova OA, Goltsov AY, Abramova LI, Kaleda VG, Orlova VA, Rogaev EI 2007. MicroRNA in schizophrenia: genetic and expression analysis of miR-130b (22q11). Biochemistry (Mosc) 72: 578–582 - PubMed

Publication types