Protein side-chain resonance assignment and NOE assignment using RDC-defined backbones without TOCSY data
- PMID: 21706248
- PMCID: PMC3155202
- DOI: 10.1007/s10858-011-9522-4
Protein side-chain resonance assignment and NOE assignment using RDC-defined backbones without TOCSY data
Abstract
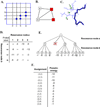
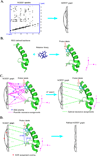
One bottleneck in NMR structure determination lies in the laborious and time-consuming process of side-chain resonance and NOE assignments. Compared to the well-studied backbone resonance assignment problem, automated side-chain resonance and NOE assignments are relatively less explored. Most NOE assignment algorithms require nearly complete side-chain resonance assignments from a series of through-bond experiments such as HCCH-TOCSY or HCCCONH. Unfortunately, these TOCSY experiments perform poorly on large proteins. To overcome this deficiency, we present a novel algorithm, called NASCA: (NOE Assignment and Side-Chain Assignment), to automate both side-chain resonance and NOE assignments and to perform high-resolution protein structure determination in the absence of any explicit through-bond experiment to facilitate side-chain resonance assignment, such as HCCH-TOCSY. After casting the assignment problem into a Markov Random Field (MRF), NASCA: extends and applies combinatorial protein design algorithms to compute optimal assignments that best interpret the NMR data. The MRF captures the contact map information of the protein derived from NOESY spectra, exploits the backbone structural information determined by RDCs, and considers all possible side-chain rotamers. The complexity of the combinatorial search is reduced by using a dead-end elimination (DEE) algorithm, which prunes side-chain resonance assignments that are provably not part of the optimal solution. Then an A* search algorithm is employed to find a set of optimal side-chain resonance assignments that best fit the NMR data. These side-chain resonance assignments are then used to resolve the NOE assignment ambiguity and compute high-resolution protein structures. Tests on five proteins show that NASCA: assigns resonances for more than 90% of side-chain protons, and achieves about 80% correct assignments. The final structures computed using the NOE distance restraints assigned by NASCA: have backbone RMSD 0.8-1.5 Å from the reference structures determined by traditional NMR approaches.
Figures


Similar articles
-
High-resolution protein structure determination starting with a global fold calculated from exact solutions to the RDC equations.J Biomol NMR. 2009 Nov;45(3):265-81. doi: 10.1007/s10858-009-9366-3. Epub 2009 Aug 27. J Biomol NMR. 2009. PMID: 19711185 Free PMC article.
-
Protein NMR structure determination with automated NOE assignment using the new software CANDID and the torsion angle dynamics algorithm DYANA.J Mol Biol. 2002 May 24;319(1):209-27. doi: 10.1016/s0022-2836(02)00241-3. J Mol Biol. 2002. PMID: 12051947
-
An efficient and accurate algorithm for assigning nuclear overhauser effect restraints using a rotamer library ensemble and residual dipolar couplings.Proc IEEE Comput Syst Bioinform Conf. 2005:189-202. doi: 10.1109/csb.2005.13. Proc IEEE Comput Syst Bioinform Conf. 2005. PMID: 16447976
-
NMR-based automated protein structure determination.Arch Biochem Biophys. 2017 Aug 15;628:24-32. doi: 10.1016/j.abb.2017.02.011. Epub 2017 Mar 2. Arch Biochem Biophys. 2017. PMID: 28263718 Review.
-
Automated projection spectroscopy and its applications.Top Curr Chem. 2012;316:21-47. doi: 10.1007/128_2011_189. Top Curr Chem. 2012. PMID: 21710379 Review.
Cited by
-
HASH: a program to accurately predict protein Hα shifts from neighboring backbone shifts.J Biomol NMR. 2013 Jan;55(1):105-18. doi: 10.1007/s10858-012-9693-7. Epub 2012 Dec 16. J Biomol NMR. 2013. PMID: 23242797 Free PMC article.
-
OSPREY: protein design with ensembles, flexibility, and provable algorithms.Methods Enzymol. 2013;523:87-107. doi: 10.1016/B978-0-12-394292-0.00005-9. Methods Enzymol. 2013. PMID: 23422427 Free PMC article.
-
Drug-target interaction prediction by integrating chemical, genomic, functional and pharmacological data.Pac Symp Biocomput. 2014:148-59. Pac Symp Biocomput. 2014. PMID: 24297542 Free PMC article.
-
A Bayesian approach for determining protein side-chain rotamer conformations using unassigned NOE data.J Comput Biol. 2011 Nov;18(11):1661-79. doi: 10.1089/cmb.2011.0172. Epub 2011 Oct 4. J Comput Biol. 2011. PMID: 21970619 Free PMC article.
-
Protein loop closure using orientational restraints from NMR data.Proteins. 2012 Feb;80(2):433-53. doi: 10.1002/prot.23207. Epub 2011 Dec 13. Proteins. 2012. PMID: 22161780 Free PMC article.
References
-
- Altschul SF, Gish W, Miller W, Myers EW, Lipman DJ. Basic local alignment search tool. J Mol Biol. 1990;215(3):403–410. - PubMed
-
- Atreya HS, Sahu SC, Chary KV, Govil G. A tracked approach for automated nmr assignments in proteins (tatapro) J Biomol NMR. 2000;17(2):125–136. - PubMed
-
- Bailey-Kellogg C, Chainraj S, Pandurangan G. A Random Graph Approach to NMR Sequential Assignment. Journal of Computational Biology. 2005;12(6):569–583. - PubMed
-
- Bailey-Kellogg C, Widge A, Kelley JJ, Berardi MJ, Bushweller JH, Donald BR. The NOESY jigsaw: automated protein secondary structure and main-chain assignment from sparse, unassigned NMR data. Journal of Computational Biology. 2000;7(3–4):537–558. - PubMed
Publication types
MeSH terms
Substances
Grants and funding
LinkOut - more resources
Full Text Sources
Miscellaneous

