

Neuronal and glial markers are differently associated with computed tomography findings and outcome in patients with severe traumatic brain injury: a case control study
- PMID: 21702960
- PMCID: PMC3219030
- DOI: 10.1186/cc10286
Neuronal and glial markers are differently associated with computed tomography findings and outcome in patients with severe traumatic brain injury: a case control study
Abstract
Introduction: Authors of several studies have studied biomarkers and computed tomography (CT) findings in the acute phase after severe traumatic brain injury (TBI). However, the correlation between structural damage as assessed by neuroimaging and biomarkers has not been elucidated. The aim of this study was to investigate the relationships among neuronal (Ubiquitin carboxy-terminal hydrolase L1 [UCH-L1]) and glial (glial fibrillary acidic protein [GFAP]) biomarker levels in serum, neuroradiological findings and outcomes after severe TBI.
Methods: The study recruited patients from four neurotrauma centers. Serum samples for UCH-L1 and GFAP were obtained at the time of hospital admission and every 6 hours thereafter. CT scans of the brain were obtained within 24hrs of injury. Outcome was assessed by Glasgow Outcome Scale (GOS) at discharge and at 6 months.
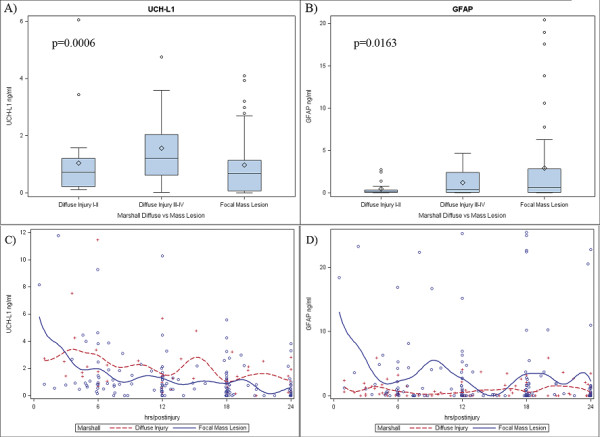
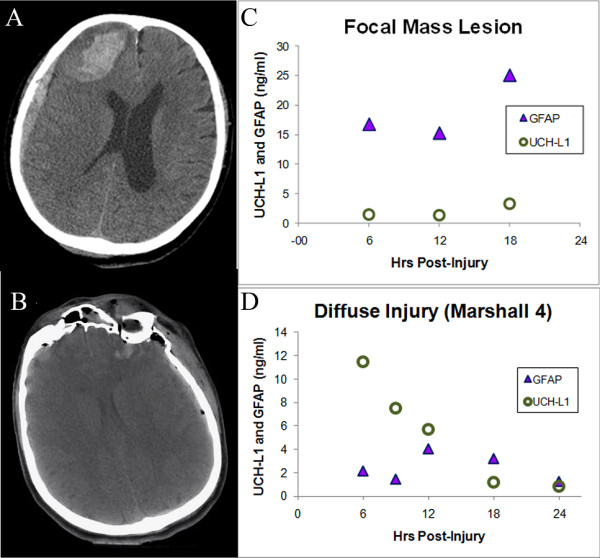
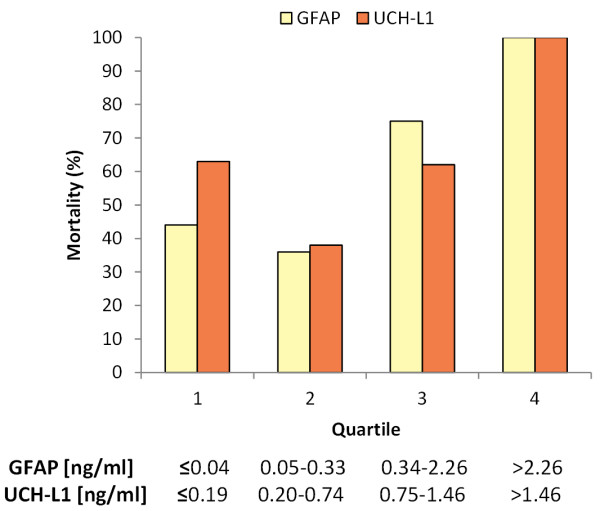
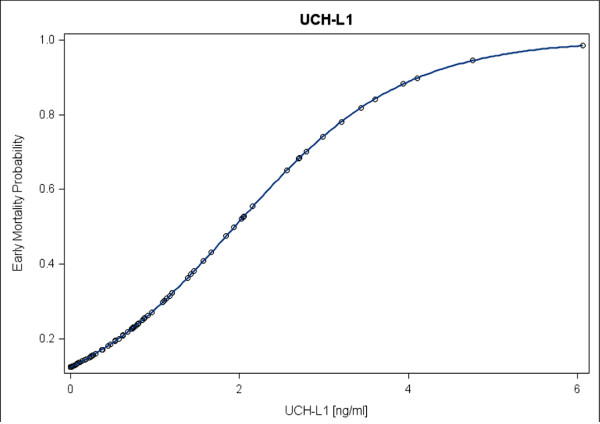
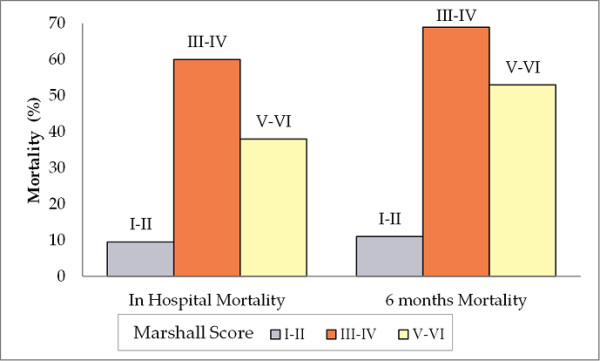
Results: 81 severe TBI patients and 167 controls were enrolled. The mean serum levels of UCH-L1 and GFAP were higher (p < 0.001) in TBI patients compared to controls. UCH-L1 and GFAP serum levels correlated significantly with Glasgow Coma Scale (GCS) and CT findings. GFAP levels were higher in patients with mass lesions than in those with diffuse injury (2.95 ± 0.48 ng/ml versus 0.74 ± 0.11 ng/ml) while UCH-L1 levels were higher in patients with diffuse injury (1.55 ± 0.18 ng/ml versus 1.21 ± 0.15 ng/ml, p = 0.0031 and 0.0103, respectively). A multivariate logistic regression showed that UCH-L1 was the only independent predictor of death at discharge [adjusted odds ratios 2.95; 95% confidence interval, 1.46-5.97], but both UCH-L1 and GFAP levels strongly predicted death 6 months post-injury.
Conclusions: Relationships between structural changes detected by neuroimaging and biomarkers indicate each biomarker may reflect a different injury pathway. These results suggest that protein biomarkers could provide better characterization of subjects at risk for specific types of cellular damage than that obtained with neuroimaging alone, as well as provide valuable information about injury severity and outcome after severe TBI.
Figures
Comment in
-
Biomarkers of focal and diffuse traumatic brain injury.Crit Care. 2011 Aug 18;15(4):183. doi: 10.1186/cc10290. Crit Care. 2011. PMID: 21955684 Free PMC article.
Similar articles
-
The Levels of Glial Fibrillary Acidic Protein and Ubiquitin C-Terminal Hydrolase-L1 During the First Week After a Traumatic Brain Injury: Correlations With Clinical and Imaging Findings.Neurosurgery. 2016 Sep;79(3):456-64. doi: 10.1227/NEU.0000000000001226. Neurosurgery. 2016. PMID: 26963330
-
Acute biomarkers of traumatic brain injury: relationship between plasma levels of ubiquitin C-terminal hydrolase-L1 and glial fibrillary acidic protein.J Neurotrauma. 2014 Jan 1;31(1):19-25. doi: 10.1089/neu.2013.3040. Epub 2013 Oct 9. J Neurotrauma. 2014. PMID: 23865516 Free PMC article.
-
Glial Fibrillary Acidic Protein and Ubiquitin C-Terminal Hydrolase-L1 as Outcome Predictors in Traumatic Brain Injury.World Neurosurg. 2016 Mar;87:8-20. doi: 10.1016/j.wneu.2015.10.066. Epub 2015 Nov 10. World Neurosurg. 2016. PMID: 26547005
-
Serum ubiquitin C-terminal hydrolase L1 as a biomarker for traumatic brain injury: a systematic review and meta-analysis.Am J Emerg Med. 2015 Sep;33(9):1191-6. doi: 10.1016/j.ajem.2015.05.023. Epub 2015 May 29. Am J Emerg Med. 2015. PMID: 26087705 Review.
-
The game changer: UCH-L1 and GFAP-based blood test as the first marketed in vitro diagnostic test for mild traumatic brain injury.Expert Rev Mol Diagn. 2024 Jan-Feb;24(1-2):67-77. doi: 10.1080/14737159.2024.2306876. Epub 2024 Jan 31. Expert Rev Mol Diagn. 2024. PMID: 38275158 Review.
Cited by
-
Serum glial fibrillary acidic protein as a specific marker for necrotizing meningoencephalitis in Pug dogs.J Vet Med Sci. 2013 Nov;75(11):1543-5. doi: 10.1292/jvms.13-0252. Epub 2013 Jul 12. J Vet Med Sci. 2013. PMID: 23856761 Free PMC article.
-
Blood Biomarkers in Brain Injury Medicine.Curr Phys Med Rehabil Rep. 2022 Feb 26;2022:10.1007/s40141-022-00343-w. doi: 10.1007/s40141-022-00343-w. Curr Phys Med Rehabil Rep. 2022. PMID: 35433117 Free PMC article.
-
Serum ubiquitin C-terminal hydrolase L1 predicts cognitive impairment in patients with acute organophosphorus pesticide poisoning.J Clin Lab Anal. 2019 Sep;33(7):e22947. doi: 10.1002/jcla.22947. Epub 2019 Jun 14. J Clin Lab Anal. 2019. PMID: 31199012 Free PMC article.
-
Proteomic differences between focal and diffuse traumatic brain injury in human brain tissue.Sci Rep. 2018 May 1;8(1):6807. doi: 10.1038/s41598-018-25060-0. Sci Rep. 2018. PMID: 29717219 Free PMC article.
-
Blood-Based Biomarkers in Traumatic Brain Injury: A Narrative Review With Implications for the Legal System.Cureus. 2023 Jun 14;15(6):e40417. doi: 10.7759/cureus.40417. eCollection 2023 Jun. Cureus. 2023. PMID: 37325684 Free PMC article. Review.
References
-
- Marshall LF, Marshall SB, Klauber MR, Van Berkum Clark M, Eisenber HM, Jane JA, Luersse TJ, Marmarou A, Foulkes Ma. A new classification of head injury based on computerized tomography. J Neurosurg. 1991;75(Suppl):14–20.
-
- Maas AI, Hukkelhoven CW, Marshall LF, Steyerberg EW. Prediction of outcome in traumatic brain injury with computed tomographic characteristics: a comparison between the computed tomographic classification and combinations of computed tomographic predictors. Neurosurgery. 2005;57:1173–1182. - PubMed
Publication types
MeSH terms
Substances
Grants and funding
LinkOut - more resources
Full Text Sources
Other Literature Sources
Medical
Miscellaneous
