

Auditory brainstem responses predict auditory nerve fiber thresholds and frequency selectivity in hearing impaired chinchillas
- PMID: 21699970
- PMCID: PMC3179834
- DOI: 10.1016/j.heares.2011.06.002
Auditory brainstem responses predict auditory nerve fiber thresholds and frequency selectivity in hearing impaired chinchillas
Abstract
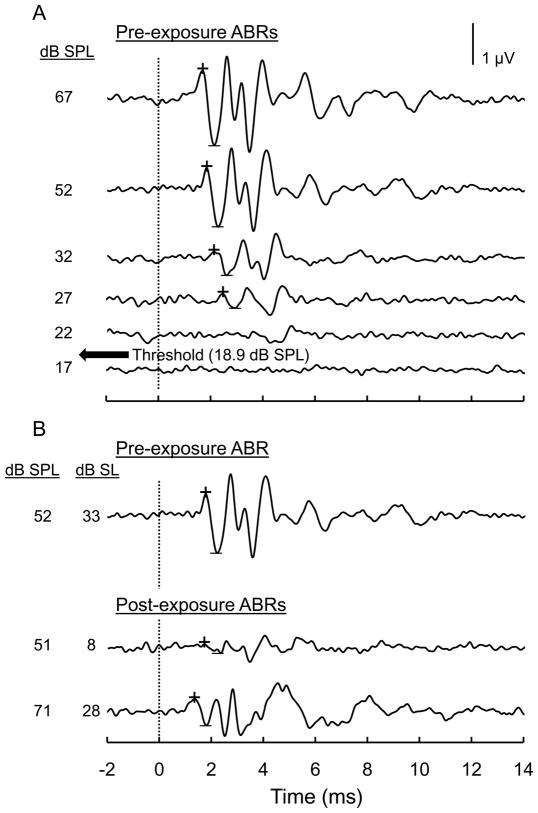
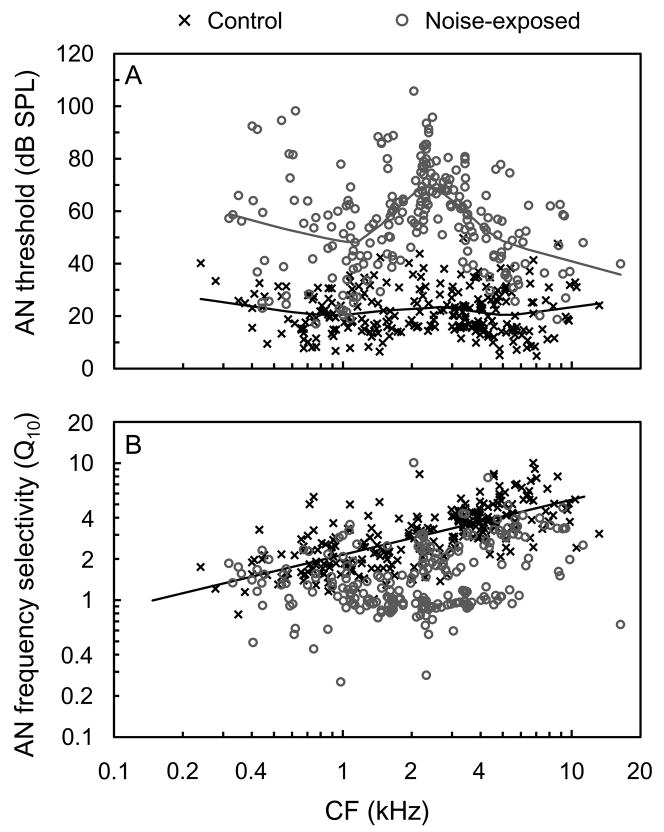
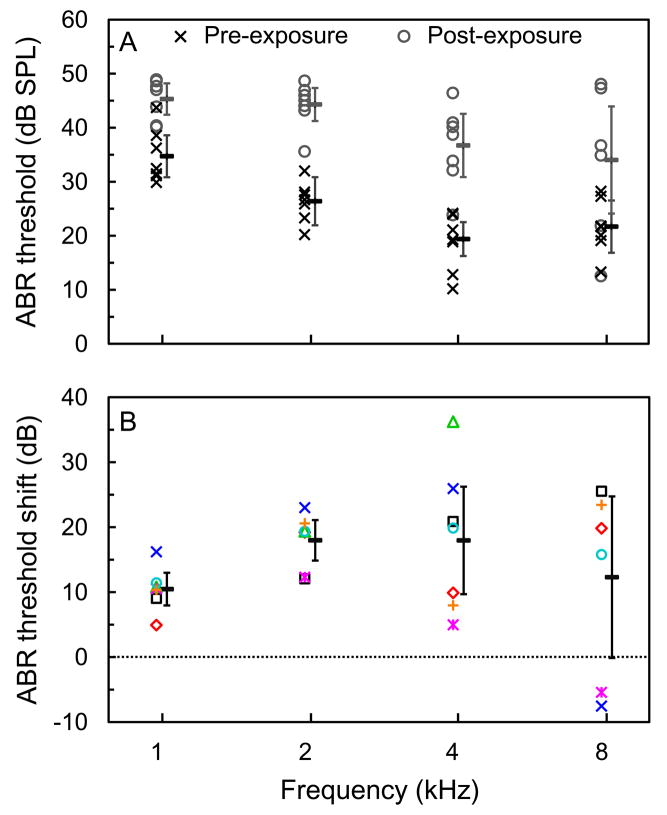
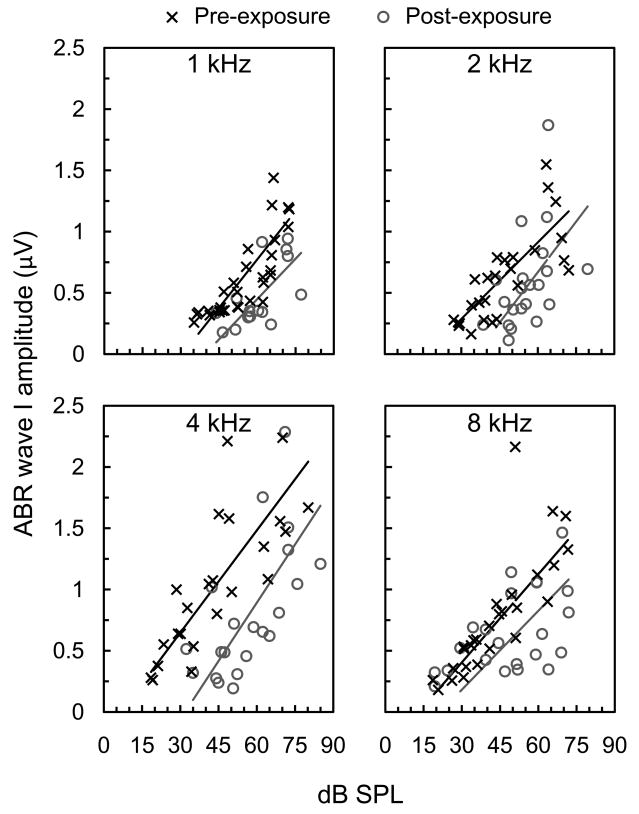
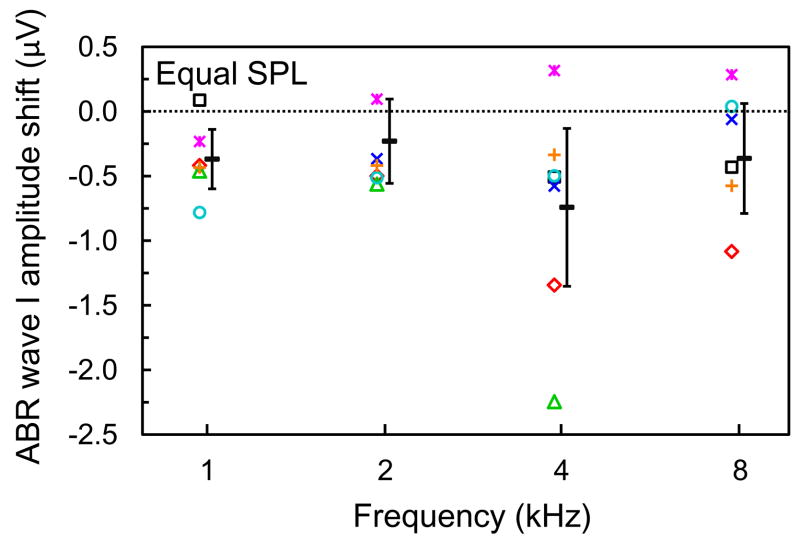
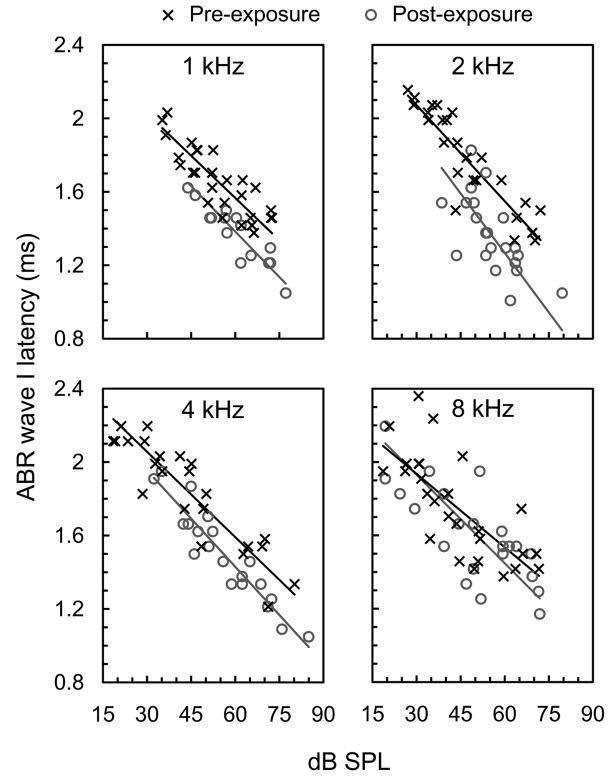
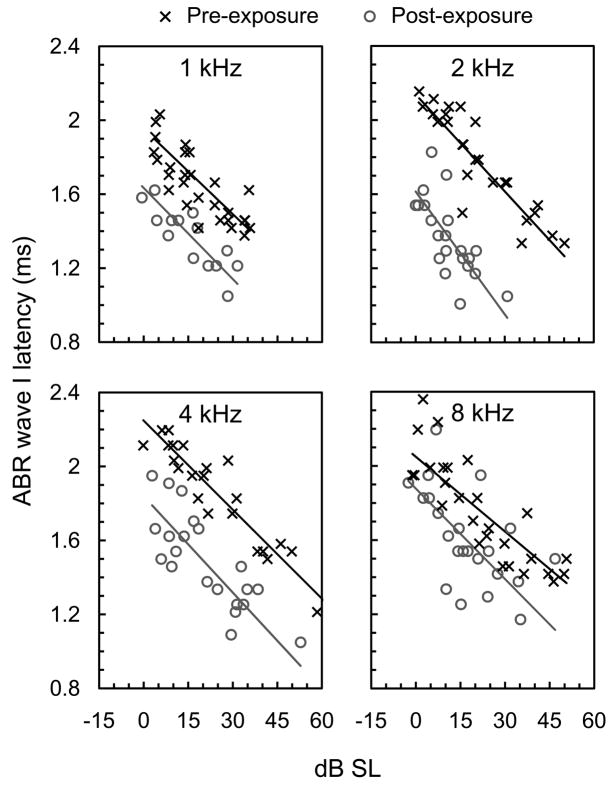
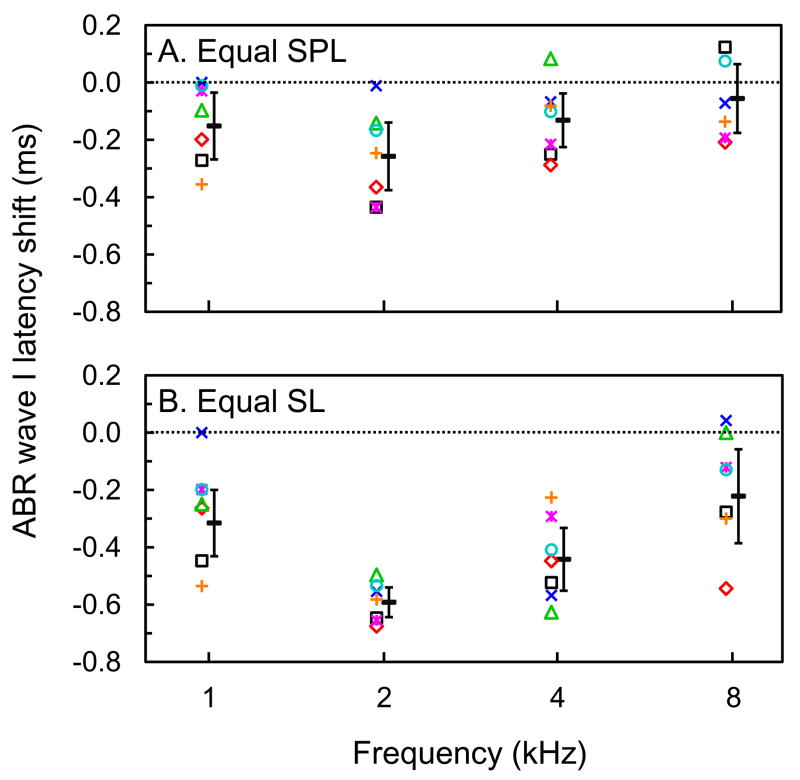
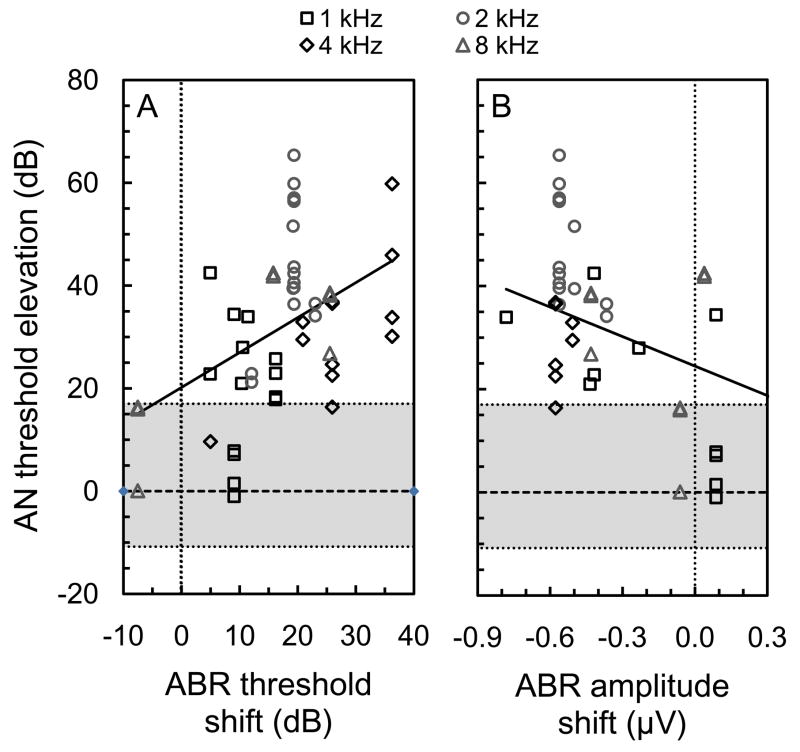
Noninvasive auditory brainstem responses (ABRs) are commonly used to assess cochlear pathology in both clinical and research environments. In the current study, we evaluated the relationship between ABR characteristics and more direct measures of cochlear function. We recorded ABRs and auditory nerve (AN) single-unit responses in seven chinchillas with noise-induced hearing loss. ABRs were recorded for 1-8 kHz tone burst stimuli both before and several weeks after 4 h of exposure to a 115 dB SPL, 50 Hz band of noise with a center frequency of 2 kHz. Shifts in ABR characteristics (threshold, wave I amplitude, and wave I latency) following hearing loss were compared to AN-fiber tuning curve properties (threshold and frequency selectivity) in the same animals. As expected, noise exposure generally resulted in an increase in ABR threshold and decrease in wave I amplitude at equal SPL. Wave I amplitude at equal sensation level (SL), however, was similar before and after noise exposure. In addition, noise exposure resulted in decreases in ABR wave I latency at equal SL and, to a lesser extent, at equal SPL. The shifts in ABR characteristics were significantly related to AN-fiber tuning curve properties in the same animal at the same frequency. Larger shifts in ABR thresholds and ABR wave I amplitude at equal SPL were associated with greater AN threshold elevation. Larger reductions in ABR wave I latency at equal SL, on the other hand, were associated with greater loss of AN frequency selectivity. This result is consistent with linear systems theory, which predicts shorter time delays for broader peripheral frequency tuning. Taken together with other studies, our results affirm that ABR thresholds and wave I amplitude provide useful estimates of cochlear sensitivity. Furthermore, comparisons of ABR wave I latency to normative data at the same SL may prove useful for detecting and characterizing loss of cochlear frequency selectivity.
Copyright © 2011 Elsevier B.V. All rights reserved.
Figures

Similar articles
-
Auditory function in normal-hearing, noise-exposed human ears.Ear Hear. 2015 Mar-Apr;36(2):172-84. doi: 10.1097/AUD.0000000000000107. Ear Hear. 2015. PMID: 25350405 Free PMC article.
-
Effects of noise exposure on young adults with normal audiograms I: Electrophysiology.Hear Res. 2017 Feb;344:68-81. doi: 10.1016/j.heares.2016.10.028. Epub 2016 Nov 2. Hear Res. 2017. PMID: 27816499 Free PMC article.
-
Effects of lifetime noise exposure on the middle-age human auditory brainstem response, tinnitus and speech-in-noise intelligibility.Hear Res. 2018 Aug;365:36-48. doi: 10.1016/j.heares.2018.06.003. Epub 2018 Jun 12. Hear Res. 2018. PMID: 29913342
-
Genetic influences on susceptibility of the auditory system to aging and environmental factors.Scand Audiol Suppl. 1992;36:1-39. Scand Audiol Suppl. 1992. PMID: 1488615 Review.
-
Frequency specificity of the auditory brainstem response elicited by 1,000-Hz filtered clicks.Audiology. 1990;29(4):181-95. doi: 10.3109/00206099009072849. Audiology. 1990. PMID: 2222287 Review.
Cited by
-
Cutting Through the Noise: Noise-Induced Cochlear Synaptopathy and Individual Differences in Speech Understanding Among Listeners With Normal Audiograms.Ear Hear. 2022 Jan/Feb;43(1):9-22. doi: 10.1097/AUD.0000000000001147. Ear Hear. 2022. PMID: 34751676 Free PMC article.
-
A multi-channel EEG mini-cap can improve reliability for recording auditory brainstem responses in chinchillas.J Neurosci Methods. 2023 Oct 1;398:109954. doi: 10.1016/j.jneumeth.2023.109954. Epub 2023 Aug 23. J Neurosci Methods. 2023. PMID: 37625650 Free PMC article.
-
Suppression Measured from Chinchilla Auditory-Nerve-Fiber Responses Following Noise-Induced Hearing Loss: Adaptive-Tracking and Systems-Identification Approaches.Adv Exp Med Biol. 2016;894:285-295. doi: 10.1007/978-3-319-25474-6_30. Adv Exp Med Biol. 2016. PMID: 27080669 Free PMC article.
-
The chinchilla animal model for hearing science and noise-induced hearing loss.J Acoust Soc Am. 2019 Nov;146(5):3710. doi: 10.1121/1.5132950. J Acoust Soc Am. 2019. PMID: 31795699 Free PMC article. Review.
-
Noise-induced hearing loss increases the temporal precision of complex envelope coding by auditory-nerve fibers.Front Syst Neurosci. 2014 Feb 17;8:20. doi: 10.3389/fnsys.2014.00020. eCollection 2014. Front Syst Neurosci. 2014. PMID: 24596545 Free PMC article.
References
-
- Attias J, Pratt H. Auditory evoked potentials and audiological follow up of subjects developing noise induced permanent threshold shift. Audiology. 1985;23:498–508. - PubMed
-
- Borg E, Nilsson R, Engström B. Effect of the acoustic reflex on inner ear damage induced by industrial noise. Acta Otolaryngol. 1983;96:361–369. - PubMed
-
- Buchwald JS, Huang CM. Far field acoustic response: origins in cat. Science. 1975;189:382–384. - PubMed
-
- Chung JW, Ahn JH, Kim JY, Lee HJ, Kang HH, Lee YK, Kim JU, Koo SW. The effect of isoflurane, halothane and pentobarbital on noise-induced hearing loss in mice. Anesth Analg. 2007;104:1404–1408. - PubMed
Publication types
MeSH terms
Grants and funding
LinkOut - more resources
Full Text Sources
Research Materials
Miscellaneous
