. 2011;6(6):e20924.
doi: 10.1371/journal.pone.0020924. Epub 2011 Jun 9.

The reconstruction of condition-specific transcriptional modules provides new insights in the evolution of yeast AP-1 proteins

Affiliations

The reconstruction of condition-specific transcriptional modules provides new insights in the evolution of yeast AP-1 proteins

Christel Goudot et al. PLoS One. 2011.

Abstract

AP-1 proteins are transcription factors (TFs) that belong to the basic leucine zipper family, one of the largest families of TFs in eukaryotic cells. Despite high homology between their DNA binding domains, these proteins are able to recognize diverse DNA motifs. In yeasts, these motifs are referred as YRE (Yap Response Element) and are either seven (YRE-Overlap) or eight (YRE-Adjacent) base pair long. It has been proposed that the AP-1 DNA binding motif preference relies on a single change in the amino acid sequence of the yeast AP-1 TFs (an arginine in the YRE-O binding factors being replaced by a lysine in the YRE-A binding Yaps). We developed a computational approach to infer condition-specific transcriptional modules associated to the orthologous AP-1 protein Yap1p, Cgap1p and Cap1p, in three yeast species: the model yeast Saccharomyces cerevisiae and two pathogenic species Candida glabrata and Candida albicans. Exploitation of these modules in terms of predictions of the protein/DNA regulatory interactions changed our vision of AP-1 protein evolution. Cis-regulatory motif analyses revealed the presence of a conserved adenine in 5' position of the canonical YRE sites. While Yap1p, Cgap1p and Cap1p shared a remarkably low number of target genes, an impressive conservation was observed in the YRE sequences identified by Yap1p and Cap1p. In Candida glabrata, we found that Cgap1p, unlike Yap1p and Cap1p, recognizes YRE-O and YRE-A motifs. These findings were supported by structural data available for the transcription factor Pap1p (Schizosaccharomyces pombe). Thus, whereas arginine and lysine substitutions in Cgap1p and Yap1p proteins were reported as responsible for a specific YRE-O or YRE-A preference, our analyses rather suggest that the ancestral yeast AP-1 protein could recognize both YRE-O and YRE-A motifs and that the arginine/lysine exchange is not the only determinant of the specialization of modern Yaps for one motif or another.


Conflict of interest statement

Competing Interests: The authors have declared that no competing interests exist.

Figures

Figure 1
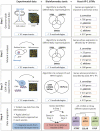
Figure 1. Reconstruction of the yeast AP-1 benomyl-specific transcriptional modules (bTMs) in species S. cerevisiae, C. glabrata and C. albicans.
Three different sources of genome-wide experimental datasets (expression data, mutant analyses and ChIP-chip experiments) were collected from the literature and successively analyzed using several bioinformatics tools. In each yeast species (S. cerevisiae, C. glabrata and C. albicans) the same procedure, divided into four independent steps, was applied. Step 1 consisted in identifying genes whose expression was up regulated in response to benomyl induced-stress. Results arising from 42 microarray experiments were analyzed using a combination of 3 different algorithms SAM, LIMMA and SMVar (see Materials and Methods). 786, 327 and 337 genes were respectively selected in S. cerevisiae, C. glabrata and C. albicans. Step 2 consisted in identifying genes whose expression in response to benomyl induced-stress was affected by the deletion of genes coding TFs Yap1p (in S. cerevisiae), Cgap1p (in C. glabrata) or Cap1p (in C. albicans). 32 microarray experiments were analyzed using the algorithm SAM, LIMMA and SMVar (see Material and Methods) and 33, 134 and 168 genes were identified in S. cerevisiae, C. glabrata and C. albicans genomes, respectively. Step 3 consisted in identifying genes whose promoter interacted in vivo with TFs Yap1p, Cgap1p or Cap1p. Data obtained with ChIP chip technologies (12 experiments) were analyzed combining SAM, LIMMA and SMVar algorithms together with ChIPmix program. 260, 416 and 373 genes were thus identified respectively in S. cerevisiae, C. glabrata and C. albicans. Finally, Step 4 consisted in data integration. For that results obtained in Step 1, 2, and 3 were combined using the following rule: to be conserved in the final AP-1 bTM a gene had to be selected in “Step 1 and Step 2” or in “Step 1 and Step 3”. In S. cerevisiae (SCERE) the Yap1 bTM therefore comprised 67 genes, in C. glabrata (CGLAB) the Cgap1p bTM comprised 98 genes, and finally in C. albicans (CALB) the Cap1p bTM comprised 130 genes. All together, we combined in this analysis experimental results arising from more than 80 individual microarray experiments applying different bioinformatics methodologies. The predictive strength of the strategy is based on the combined constraints that arise from the use of multiple biological and bioinformatics data sources.
Figure 2
Figure 2. Cross-species comparison of the S. cerevisiae, C. glabrata and C. albicans bTMs based on sequence orthology and homology.
(A) Yeast AP-1 bTMs were defined using the general protocol presented in Figure 1. They are represented here using a Venn diagram with the following color code: purple circle for Yap1p bTM (SCERE), orange circle for Cgap1p bTM (CGLAB) and green circle for Cap1p bTM (CALB). Overlaps between bTMs represent the number of orthologous relationships (inferred with the INPARANOID algorithm, see Materials and Methods) between them. Only 11 orthologous genes were thus identified between the SCERE and CGLAB AP-1 bTMs (16%), 7 between the SCERE and CALB AP-1 bTMs (10%) and 14 between the CGLAB and the CALB AP-1 bTMs (14%). Considering the global amount of orthologous genes between the three species (more than 60%), these values were surprisingly low and suggested that in yeasts, there exist functional similarities between proteins that are not reflected in sequence orthology. (B) Comparison between the Cgap1p (in C. glabrata) and the Cap1p (in C. albicans) bTMs identified based on experimental datasets, and the bTMs predicted based on protein sequence similarity with the Yap1p (in S. cerevisiae) bTM, i.e. functional annotation transfer from the model yeast S. cerevisiae to the Candida species. The original Cgap1p and Cap1p bTMs are represented using respectively orange and green circles, whereas the predicted bTMs are shown with circles surrounding by purple dashed lines. The predicted bTMs were obtained searching in Candida genomes for homologous proteins with the Yap1p bTM using the BLAST algorithm (see Materials and Methods). Overlaps between original and predicted bTMs represent the number of genes in common. Considering the Candida bTMs identified using experimental datasets as a reference, false positive (FP) and false negative (FN) rates associated to the bTMs predictions were calculated and are shown here. In each species, FN and FP represent important error rates (more than 70%), if one tries to defined AP-1 bTMs in Candida species directly transferring information from the well-studied S. cerevisiae species.
Figure 3
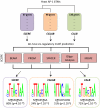
Figure 3. Identification of cis-regulatory motifs in promoter sequences of AP-1 bTM genes.
Yeast AP-1 bTMs were characterized using the procedure presented in Figure 1. They are represented here using the following color code: Yap1p bTM in S. cerevisiae (SCERE) in purple, Cgap1p bTM in C. glabrata (CGLAB) in orange, Cap1p bTM in C. albicans in green. Promoter sequences of genes were analyzing using a combination of five different algorithms (BEAM, PRISM, SPACER, Oligo-Analysis and MEME) and applying a filter procedure to select the most significant motifs (see Material and Methods and Text S3). 12 motifs were identified in SCERE, 7 motifs in CGLAB and 8 motifs in CALB. They are presented in Text S4. In each species, these motifs were combined and consensus sequences are shown here (SeqLogo representations). A unique consensus MTKASTMA was observed in promoters of SCERE and CALB genes and two consensuses (MTTASSTAA, ATTACHAAW) were observed in promoters of CGLAB genes (where M designates A or C, K designates G or T, S designates C or G and W designates A or T). Percentages of genes in each AP-1 bTMs that exhibit those consensuses are indicated below the SeqLogo representations, with the associated enrichment p-value (see Materials and Methods). Highly conserved positions between the consensuses are underlined. They are predicted to strongly interact with the TF DNA binding domain, based on structural inspection of the Pap1p/DNA complex (see Figure 4).
Figure 4
Figure 4. Structural explorations of yeast AP-1 transcription factor DNA recognition properties.
(A) Structure of the Pap1p bZIP dimer as defined in the PDB file 1GD2. Pap1p is the closest Yap1p functional homologue in the yeast S. pombe (see Main Text). Two identical chains of Pap1p proteins are represented. They are labeled E and F and colored in blue. Only the leucine-zipper domains and the DNA-binding regions are shown here. They are surrounding with dashed black boxes. Leucine residues in the coiled coil region responsible for the dimerization are colored in red. The DNA fragment at which the Pap1p proteins are associated is represented in orange and is surrounding with a dashed orange box. The sequence is indicated below: AGGTTACGTAACC. Note that this sequence contains the motif TTACGTAA that is the exact YRE-A motif identified in promoter of Cgap1p-dependant genes (Figure 3). (B) Predicted interactions between Pap1p TF and DNA in the 1GD2 structure presented in (A). Three types of interactions are represented: “Salt bridge” with a pink lines, “Hydrogen bound” with a green dashed lines and “Water-mediated hydrogen bound in grey dashed lines. These interactions were identified using the MONSTER web tool (see Materials and Methods). Nine residues of the Pap1p protein interact with DNA: R82, K83, Q85, N86, R87, A89, Q90, R94 and R96. (C) Comparison of the DNA-binding domains of the AP-1 proteins Ypap1p (in S. cerevisiae), Cgap1p (in C. glabrata) and Cap1p (in C. albicans) with the DNA-binding domain of Pap1p (in S. pombe). Protein residues that are conserved in the four species analyzed in this study are labeled with a black star. In Pap1p protein, the 9 residues that are predicted to interact with DNA (see B) are underlined. From these 9 interacted residues, 8 are strictly conserved in other species, they are surrounding with a black box. Note that in the protein Cgap1p, the residue 12 described by Kuo et al. (see Main Text) is highlighted in pink.
Figure 5
Figure 5. Evolution of the DNA binding properties of the yeast AP-1 transcription factors.
Tree symbolizing the evolutionary distances between the four yeast species considered in this study is presented. Note that the lengths of the branches do not represent rigorous quantifications of the evolutionary distances. The names of the Yap1p orthologous proteins in each species are represented in colored boxes. The protein sequences of the basic region of their DNA binding domains are indicated for each factor together with the DNA consensus type (YRE-O or YRE-A). The amino acid in position 12, which had been hypothesized to be a key determinant of the discrimination between YRE-A and YRE-O recognizing factors (see the Main Text), has been highlighted in red. More precisely, the cis-regulatory motif consensus for Yap1p and Cap1p TFs is MTKASTMA (this study), the cis-regulatory consensuses identified for Cgap1p are MTTASSTAA and ATTACHAAW (this study) and the DNA consensuses identified for Pap1p are TTACGTAA and TTACTAA .

Similar articles

Cited by

References

    1. Quackenbush J. Computational approaches to analysis of DNA microarray data. Yearb Med Inform. 2006:91–103. - PubMed
    1. Nugent R, Meila M. An overview of clustering applied to molecular biology. Methods Mol Biol. 2010;620:369–404. - PubMed
    1. Eisen MB, Spellman PT, Brown PO, Botstein D. Cluster analysis and display of genome-wide expression patterns. Proc Natl Acad Sci U S A. 1998;95:14863–14868. - PMC - PubMed
    1. Wu LF, Hughes TR, Davierwala AP, Robinson MD, Stoughton R, et al. Large-scale prediction of Saccharomyces cerevisiae gene function using overlapping transcriptional clusters. Nat Genet. 2002;31:255–265. - PubMed
    1. Hughes TR, Marton MJ, Jones AR, Roberts CJ, Stoughton R, et al. Functional discovery via a compendium of expression profiles. Cell. 2000;102:109–126. - PubMed

Publication types

MeSH terms

LinkOut - more resources