Comparative Study
. 2011 Jun 23;70(6):1100-14.
doi: 10.1016/j.neuron.2011.04.031.

Overlapping role of dynamin isoforms in synaptic vesicle endocytosis

Affiliations
Comparative Study

Overlapping role of dynamin isoforms in synaptic vesicle endocytosis

Andrea Raimondi et al. Neuron. .

Abstract

The existence of neuron-specific endocytic protein isoforms raises questions about their importance for specialized neuronal functions. Dynamin, a GTPase implicated in the fission reaction of endocytosis, is encoded by three genes, two of which, dynamin 1 and 3, are highly expressed in neurons. We show that dynamin 3, thought to play a predominantly postsynaptic role, has a major presynaptic function. Although lack of dynamin 3 does not produce an overt phenotype in mice, it worsens the dynamin 1 KO phenotype, leading to perinatal lethality and a more severe defect in activity-dependent synaptic vesicle endocytosis. Thus, dynamin 1 and 3, which together account for the overwhelming majority of brain dynamin, cooperate in supporting optimal rates of synaptic vesicle endocytosis. Persistence of synaptic transmission in their absence indicates that if dynamin plays essential functions in neurons, such functions can be achieved by the very low levels of dynamin 2.


Figures

Figure 1
Figure 1
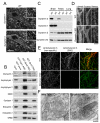
Comparative analysis of dynamin 1 and 3 in the brain and generation of dynamin 3 KO mice. (A) Double immunofluorescence with isoform specific antibodies showing that dynamin 1 and 3 share a similar localization at synapses surrounding motor neurons (spinal cord ventral horn). (B) Evaluation of proteins binding to the proline rich domain (PRD) of dynamin 1, 2 and 3 by GST pulldown from mouse brain lysates followed by immunoblotting. (C) Immunoblot analysis of dynamin isoform levels in the indicated tissues in wild type and dynamin 3 KO mice. (D) Markers of clathrin coats (AP-2 subunit α-adaptin), synaptic vesicles (synapsin 1) and active zones (bassoon) do not show any change in localization in dynamin 3 KO cortical neurons in culture. (E) Loss of dynamin 3 immunofluorescence revealed by dynamin 3 specific antibodies (clone 5H5) in primary neuron cultures. A previously described anti-dynamin 3 antibody (Gray et al., 2003) generates a punctate, non-specific immunofluorescence of dendritic spines. (F) Electron micrographs of wildtype and dynamin 3 KO synapses respectively demonstrating presence of synaptic vesicles in synapses of both genotypes. Scale bars in A and E = 10μm, D = 20μm. Scale bar in E = 200 nm. See also Figure S1.
Figure 2
Figure 2
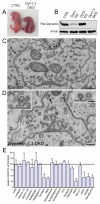
Dynamin 1,3 DKO mice exhibit perinatal lethality. (A) Photograph of a control and a DKO littermate taken ~ 2 hours after birth. Note the cyanotic color, lack of milk in stomach and hunched posture of the DKO. (B) Immunoblotting of neuronal culture lysates derived from mice of the indicated genotypes with a pan-dynamin antibody. AP180 signal was used as a neuron specific endocytic protein loading control. (C and D) Electron micrographs of brainstem synapses from dynamin 3 KO and dynamin 1,3 DKO pups respectively. Note the presence of synaptic vesicles in the DKO but with some heterogeneity in synaptic vesicle size and clathrin coated endocytic intermediates (arrow and highlighted in the insets). (E) Summary of protein levels in control versus DKO cortical neuron cultures. Measurements were made from at least 3 independent pairs of samples (mean+/−SEM * p<0.05, t test). Scale bars in (C) and (D) = 150nm. See also Figure S2.
Figure 3
Figure 3
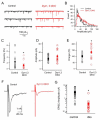
Synaptic transmission at dynamin 1,3 DKO synapses. (A) Representative traces of mEPSCs from control (black) and DKO (red) neuronal cultures. (B) Amplitude distribution of mEPSCs (n=1547 and 1857 mEPSC events recorded from a selected control and DKO respectively as shown in A). (C-E) mEPSP frequency, peak amplitude and total charge transfer (averages from 18 control and 20 DKO neurons, *p<0.05, t test). Open symbols show individual neurons and filled symbols show the average +/− SEM of each group. (F) Representative traces of evoked EPSCs from control and DKO neurons. (G) Summary of peak EPSC amplitudes plotted on a logarithmic scale (Control EPSC Amplitude: 2.82± 0.48 nA; DKO EPSC amplitude: 0.36±0.11nA, n=20 for each, t test p<0.0001). See also Figure S3
Figure 4
Figure 4
Analysis of compensatory endocytosis. (A) Dynamin 1 KO and DKO cells have a greater fraction of the vGlut1-pHluorin stranded on the surface (p=0.02 and 0.001 versus WT or dynamin 3 KO littermates respectively, 2 sample t-test, N=11, 6, 10 and 2 for WT, dynamin 3 KO dynamin 1 KO and DKO respectively). (B) Averaged vGlut1-pHluorin responses to 100 AP stimulation at 10 Hz from wildtype (40 runs from 11 cells), dynamin 3 KO (22 runs from 6 cells), dynamin 1 KO (43 runs from 11 cells) and DKO (33 runs, 11 cells), see supplemental methods for error calculation. The deficit in the amount of vGlut1-pHluorin that was not endocytosed 40s after the end of the stimulus is significant for both the dynamin 1 KO as well as for the DKO (p<0.05 and p=0.001 respectively, two sample t test with dynamin 1 KO compared to WT littermates and DKO compared to dynamin 3 KO littermates). (C) Representative vGlut1-pHluorin trace of a DKO neuron responding to three consecutive rounds of stimulation (100AP at 10Hz) with 10 minutes recovery between stimulus challenges. Traces are averages from 28 regions of interest corresponding to individual presynaptic terminals of this neuron. t1/2 times = 62s, 90s, >140s respectively. (D) Histogram of endocytosis t1/2 times for control (pooled data from WT and dynamin 3 KO), dynamin 1 KO and DKOs in response to 100AP 10Hz stimulus. Runs which did not decay to half of the ΔF within the imaging window (140s), but recovered before the following run are binned into >140s. Controls: 64 runs from 18 cells, dynamin 1 KO: 40 runs from 11 cells, DKO: 40 runs from 12 cells. (E) Endocytosis occurring during stimulation was measured by the difference between a 300AP 10Hz train and after full recovery, a subsequent 10Hz train in the presence of the proton pump inhibitor bafilomycin. Data is normalized to the maximum fluorescence obtained during stimulation in the presence of bafilomycin. Such fluorescence represents the size of the recycling pool. The panel shows sample traces from a control (dynamin 3 KO) cell and a DKO cell that recover by endocytosis 32.0% and 0% respectively of the fluorescence increase produced by exocytosis during the stimulation interval. (F) Averages of the extent of endocytosis occurring during stimulation were 20+/−5.7% for WT, 24.6±4.8% for dynamin 3 KO, 0+/−6.3% for the dynamin 1 KO and 0±9.9% for DKOs from N=8, 5, 7 and 16 cells respectively. * p=0.006 for Dynamin 1 KO versus WT and p=0.03 for DKO versus dynamin 3 KO, (2 sample t-tests). Except where indicated otherwise in panel B, error bars represent the mean+/−SEM. See also Figure S4.
Figure 5
Figure 5
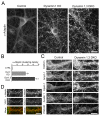
Endocytic proteins accumulate at DKO presynaptic terminals. (A) α-adaptin immunofluorescence staining is more punctate in 18 DIV DKO neurons as compared to control or even to dynamin 1 single KO neurons (see an additional time point in Fig. S4). (B) Quantification of the abundance of presynaptic terminals showing intense α-adaptin clustering (mean+/−SEM, *p<0.001 for Control versus Dyn 1 KO, Control versus DKO, and Dyn1 KO versus DKO, one way ANOVA with Tukey’s post hoc test). (C) Double-labeling for α-adaptin and VGAT or vGLUT1 respectively. (D) Immunofluorescence analysis of protein localization in control versus DKO cultures (clathrin=clathrin light chain; Amph 1=amphiphysin 1). Scale bars = 20μm. See also Figure S5.
Figure 6
Figure 6
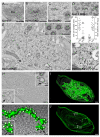
Ultrastructural analysis of endocytic intermediates formed in the absence of dynamin 1 and 3. (A) Electron micrograph of a control presynaptic terminal filled with synaptic vesicles (SVs). (B and C) Examples of DKO presynaptic terminals that reflect the range in the severity of the phenotype from nearly normal (B) to a major accumulation of clathrin coated pits (CCPs) with few remaining synaptic vesicles (C). Clathrin coated pits can be recognized even at low magnification because of their less dense packing than synaptic vesicles. (D) Higher magnification view of interconnected clathrin coated pits at a DKO synapse. (E) Large nerve terminal entirely occupied by clathrin coated pits. Inset: High magnification view demonstrates the presence of a clathrin coat surrounding the budding pits. (F) Quantification of synaptic vesicle (left) and clathrin coated structure abundance (right) expressed as their number per synaptic profile (filled circles represent individual synapses, line and whiskers represent mean+/− SEM, *p<0.0001, t test). (G) Accessibility to cholera toxin-HRP (during incubation on ice) supports the connectivity of endocytic structures (primarily clathrin coated pits) in DKO synapses to the extracellular space. (H) Tomographic section of a DKO synapse with a high number of endocytic clathrin coated pits. Boxed region is expanded in the lower left inset which shows the site (arrow) where an endocytic structure merges with the plasma membrane via a narrow opening. The upper right inset shows a similar structure as observed by traditional EM. (I and J) 3-dimensional model of the plasma membrane and endocytic intermediates derived from the tomographic series containing the section shown in panel H. (J) In this image, endocytic intermediates have been removed and white circles have been added to mark all sites where individual endocytic structures merge with the plasma membrane. The sites labeled as 1 and 2 are shown in more detail in panels H, K and L. (K and L) Reconstructed endocytic structures originating from sites 1 and 2 of panel J, superimposed on individual electron tomography sections to illustrate the site of connection with the rest of the plasma membrane. Scale bars: A-C, E, H-J= 250 nm, D, G, K and L=100 nm, H insets = 50 nm. See also Figure S6.
Figure 7
Figure 7
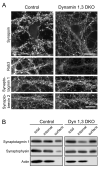
Redistribution of synaptic vesicle proteins in DKO neurons. (A) Immunofluorescence for synapsin, Rab3, synaptotagmin 1 and synaptobrevin is highly punctate within presynaptic terminals in the control but is largely dispersed throughout the axons in the DKO sample. The additional loss of the Rab3 signal in the DKO parallels the decrease in the levels of this protein as detected by immunoblotting (Fig. 2E). (B) Cell surface biotinylation experiments show that the fractions of synaptotagmin 1 and synaptophysin which are surface exposed (biotinylated) are greatly increased in the DKO. As expected, actin is exclusively detected in the internal (non-biotinylated) fraction. Scale bars in (A) = 20μm.
Figure 8
Figure 8
Activity Dependence of the Endocytic Phenotype and Relationship to the Phosphorylation State of Synapsin 1 (A) a-Adaptin (left panel) and synapsin 1 (right panel) localization in DKO neurons under conditions of basal network activity. (B) a-Adaptin (left panel) and synapsin 1 (right panel) localization in DKO neurons after silencing of electrical activity with TTX (1 mM, 16 hr). (C) Quantification of presynaptic a-adaptin clustering in control neurons and DKO neurons under basal activity conditions and in DKO neurons after TTX treatment. (D and E) Electron micrographs of DKO synapses fixed under conditions of basal activity (D) and after TTX treatment (E). Dashed lines define a region adjacent to the active zone where synaptic vesicles are conspicuously absent in (D) but very abundant in (E). In contrast, clathrin-coated pits (CCPs) around this region are abundant in (D) but absent in (E). (F) Quantification of clathrin-coated pit (CCP) abundance in control neurons and DKO neurons under basal activity conditions and in DKO neurons after TTX treatment, expressed as the percentage of CCPs relative to the total of SVs + CCPs/synapse (n = 30 control, 35 DKO, and 37 TTX-treated DKO synapses). (G) Immunoblot analysis of activity-dependent changes in neuronal proteins of control and DKO cultures. (H) Quantification of the phosphorylation of synapsin 1 at the sites indicated (percentage of control) under basal activity levels in DKO cultures (n > 3). (I and J) Effect of neuronal network activity in controlling the levels of synapsin 1 phosphorylation at sites 2 and 3 and quantification of these results, respectively. *p < 0.01, Student’s t test. Scale bars represent 20 mm (A and B) and 200 nm (D and E). All data are presented as mean ± SEM.

Similar articles

Cited by

References

    1. Ahle S, Ungewickell E. Auxilin, a newly identified clathrin-associated protein in coated vesicles from bovine brain. J Cell Biol. 1990;111:19–29. - PMC - PubMed
    1. Anggono V, Robinson PJ. Syndapin I and endophilin I bind overlapping proline-rich regions of dynamin I: role in synaptic vesicle endocytosis. J Neurochem. 2007;102:931–943. - PubMed
    1. Anggono V, Smillie KJ, Graham ME, Valova VA, Cousin MA, Robinson PJ. Syndapin I is the phosphorylation-regulated dynamin I partner in synaptic vesicle endocytosis. Nat Neurosci. 2006;9:752–760. - PMC - PubMed
    1. Aramburu J, Yaffe MB, Lopez-Rodriguez C, Cantley LC, Hogan PG, Rao A. Affinity-driven peptide selection of an NFAT inhibitor more selective than cyclosporin A. Science. 1999;285:2129–2133. - PubMed
    1. Balaji J, Ryan TA. Single-vesicle imaging reveals that synaptic vesicle exocytosis and endocytosis are coupled by a single stochastic mode. Proc Natl Acad Sci U S A. 2007;104:20576–20581. - PMC - PubMed

Publication types